

Does the Day You Sell Your RSU Vest Matter?

Hey FAANG FIRE,
We are coming off a big vesting week across multiple FAANGs. I’ve covered in detail my personal approach to RSU’s, which involves selling everything on vest and diversifying into index funds. But I have still been getting multiple reader questions, all asking the same thing:
Q: “I forgot to sell my RSU’s last week when they vested!
Is it still ok if I sell them now?”
I’ll tell you how I historically thought about this question — and then we can jump into the data to see whether it supports my personal anecdote.
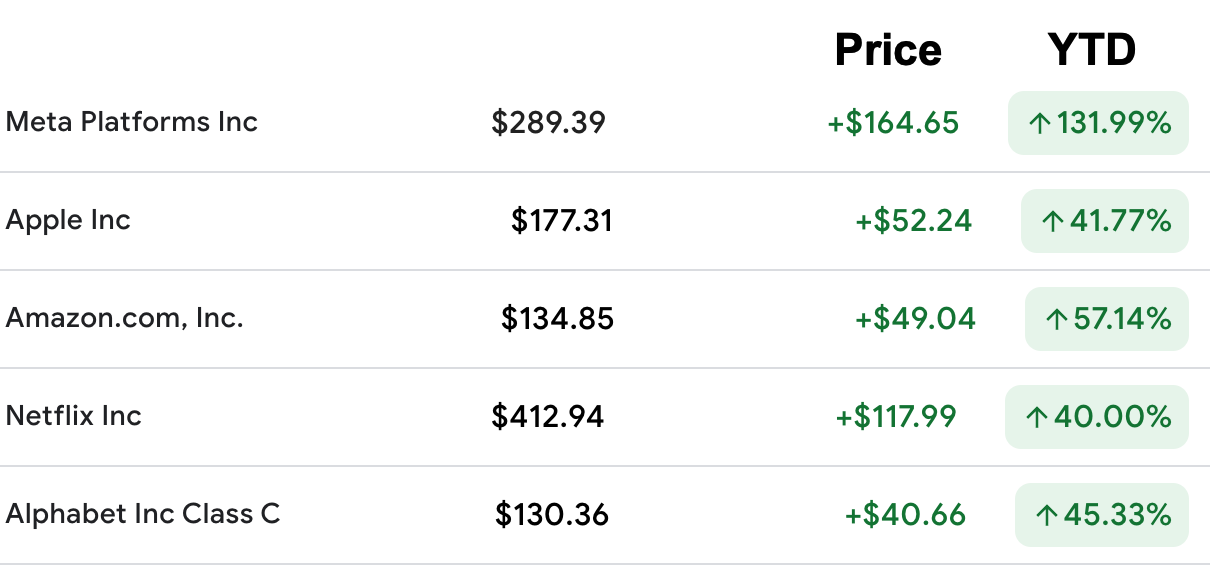
Markets
How RSU Vesting Works
When I say “I sell everything on vest” I don’t necessarily mean the literal selling of my RSU’s on the exact vesting day. In fact, it is actually not always possible to sell on the actual vesting date.
Meta RSU’s vest quarterly on February 15th, May 15th, August 15th, and November 15th.
V-Day: This is the date your shares vest — ie 2/15, 5/15, 8/15, 11/15 for Meta
V+1: The day after your vesting day. This is when the shares will be deposited in your account (minus any shares that are automatically sold to cover taxes and other withholdings). This is the first day you can actually sell your RSUs. In the case of Schwab, who Meta uses to manager their RSUs, the cost basis of the new shares will not be visible yet. You can sell these by selecting “LIFO” or Last in First Out as your selling method.
V+2: Two days after your vest. This is when all of the cost basis information for the new vests is correctly populated within Schwab.
If you sold shares in the beginning of the month for a loss. Your new vest will trigger a wash sale and not allow you to claim the loss. That is unless you also sell the new vest that triggered the wash sale in the first place. So it is a good idea to wait till V+2 to sell your newest shares to ensure you sell the right lots at the right tax basis. (Technically you can change your cost basis method after a sale but it is a little more involved).
Should I Still Sell after V+2?
This is the situation most the people emailing me are in. They meant to sell their RSU’s last week, but they just forgot. Does anything change in how they should approach selling?
I honestly wouldn’t stress this decision at all. V+1, V+2, V+15, it really will not make that much of a difference over the long run. If you had originally planned to sell your shares last week — but life got in the way — just carry out your plan this week.
You might be stressing out over the stock price dropping $10+ since the vesting date. Beating yourself up over the "lost" value that forgetting caused — but take a step back! Look at the big picture. It will all be ok. These week to week movements in your RSU values will rarely matter in the long run.
The only caveat I would mention is that if you work for a company like Meta, which subjects all employees to blackout dates, you will want to make sure to sell while the trading window is open. If you forget to sell by the last day of the trading window (August 31st, I believe, for Meta), you would need to wait until the next trading window opens. Trading windows typically occur the day after company earnings (between October 23-26th for Meta, based on historical dates).
Does the Historical Data Support This?
I’ll be the first to admit that the laissez-faire approach to selling anytime within the trading window is anecdotal. The underlying logic here is that, in the long run, the week to week fluctuations really won’t matter. Sure, Meta dropped >$10 since this most recent vest, but it could have just as easily increased. That all sounds good… but I am actually not sure whether the data fully supports this.
In the face of uncertainty… let’s actually take a look at the data for Meta stock together.
4 Hours of Analysis Later…
Hypothesis: I don’t think there will be a large difference in overall portfolio value for an investor based on when they sell their RSU’s during the open trading window (ie V+1, V+2, V+X) and diversify into index funds like VTSAX.
The first thing we need for this analysis is Meta’s historical stock price on each vesting day. Using Google Sheets we can easily compute the stock price for any given date. To start with this analysis I am going to be using every vesting date for my 9 years at Meta.
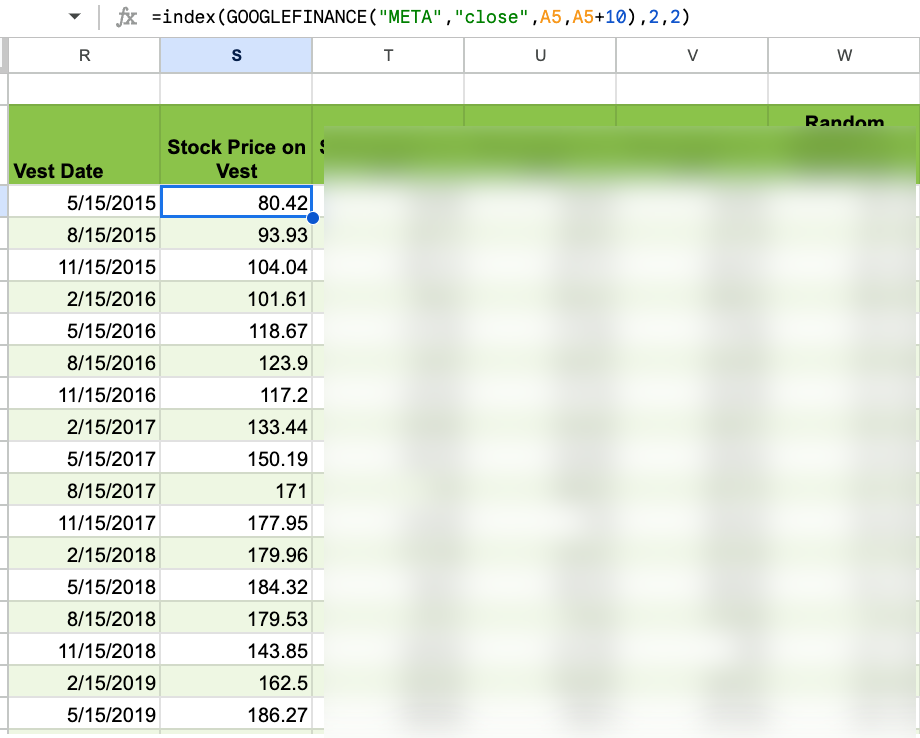
The formula I used in Google Sheets to calculate the stock price on a specific day was:
=index(GOOGLEFINANCE("META","close",A5,A5+10),2,2)This formula gives me the closing price of Meta on the first trading day on or after the vesting date (in A5 within the formula). The on or after helps avoid weekends and holidays.
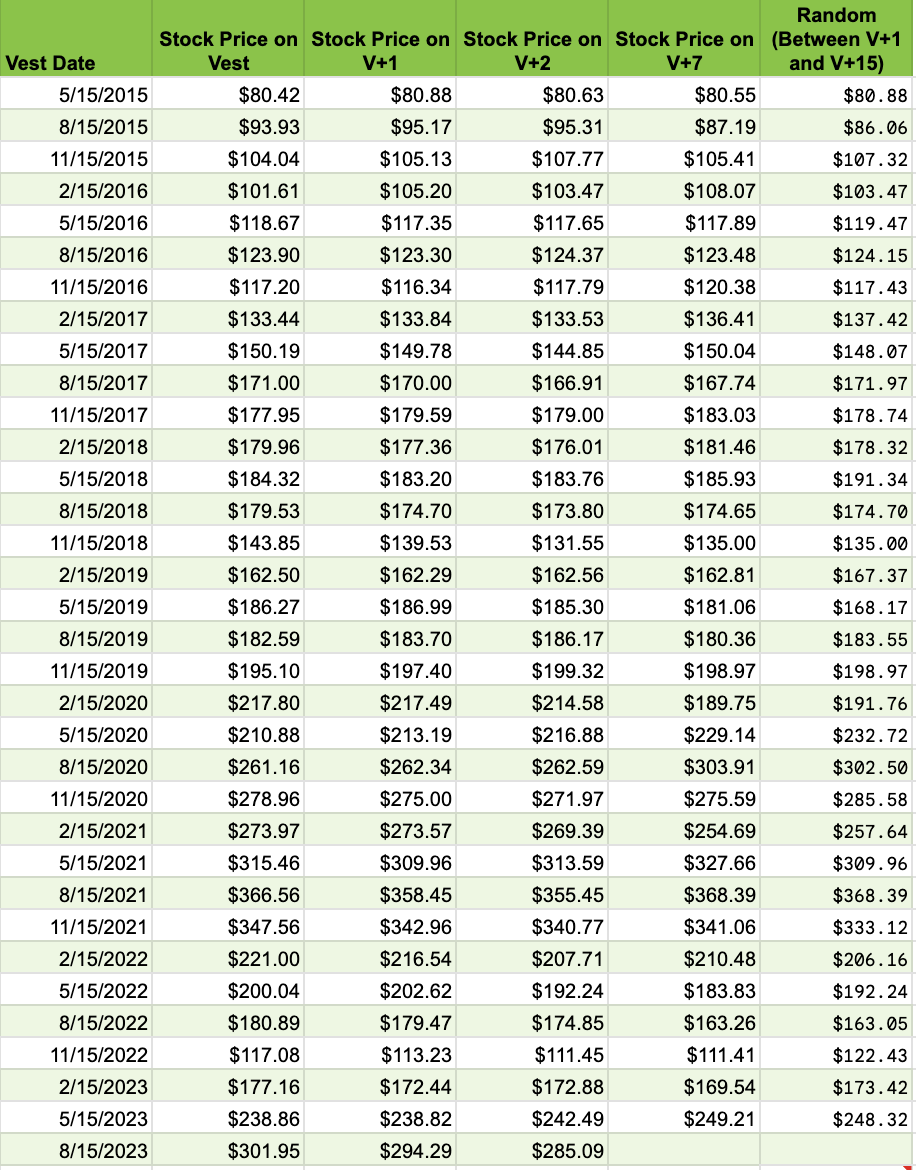
Next we repeat this calculation for V+1, V+2, V+7, and then a random day between V+1 and V+15 to simulate real world conditions of often selling at anytime during the open trading period.
So now we have the Meta stock price for all of these dates.
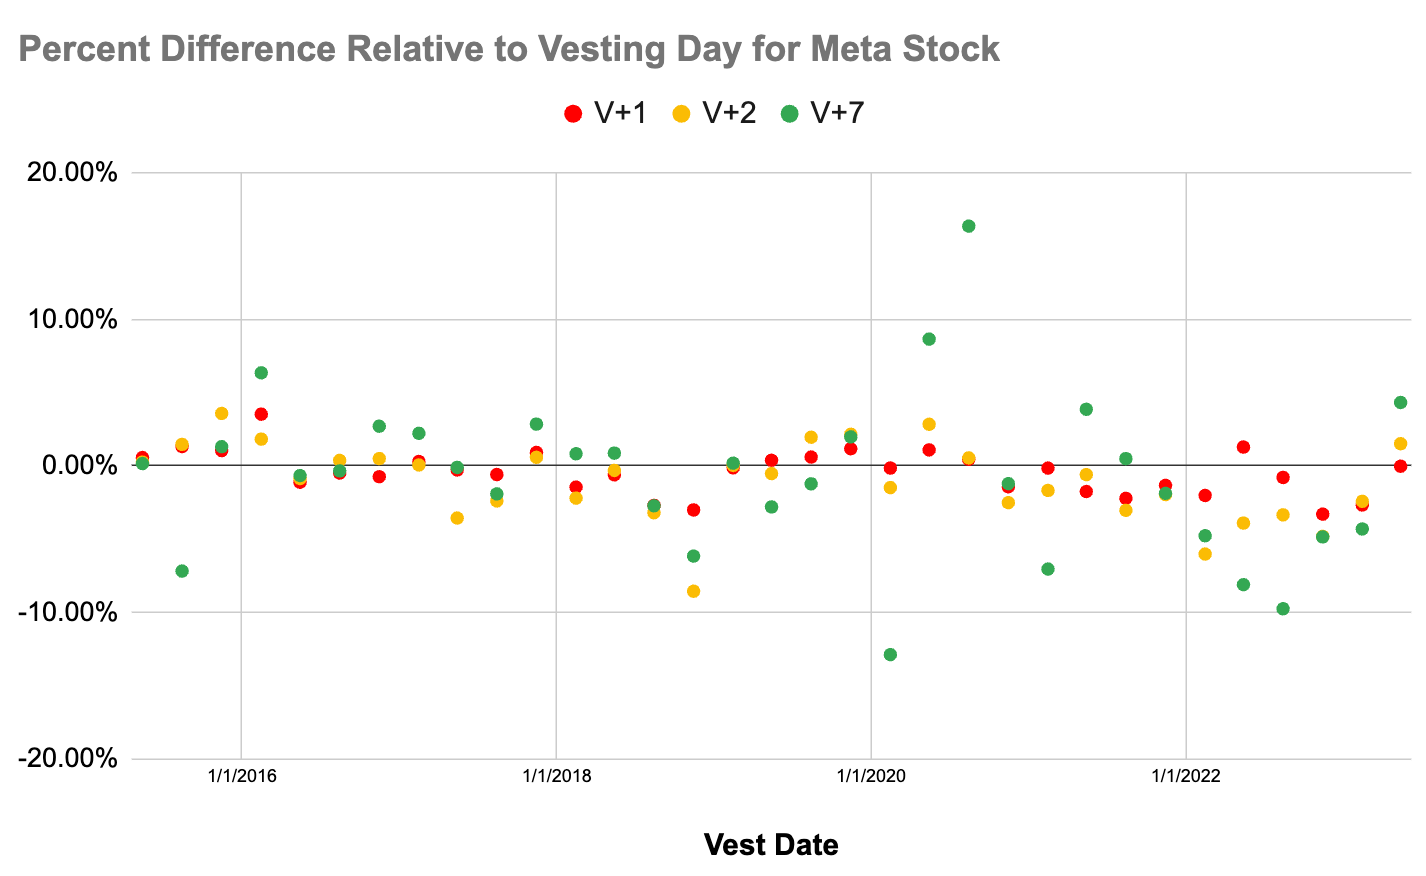
If we graph out this output we get the chart below. For each vesting date there are 4 circles representing the Meta stock price at different dates past Vesting dates. I excluded charting the random one here because I couldn’t figure out how to use a seed value in the Google sheets random function which caused the numbers to change every few seconds.
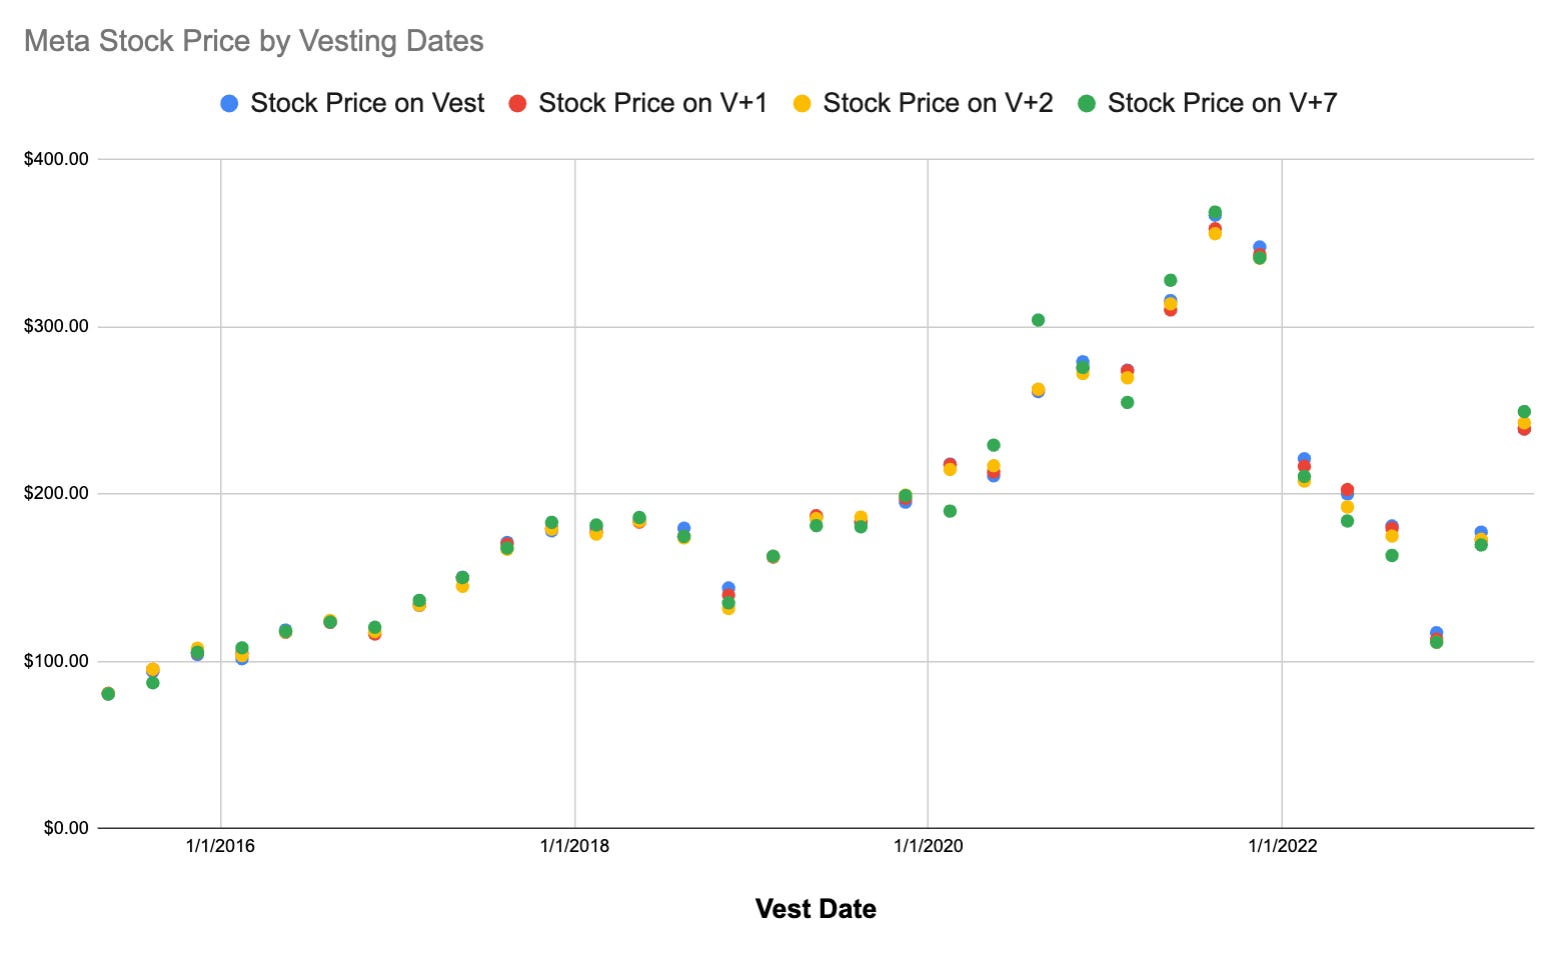
Quickly looking at the chart seems to show that, in most cases, the circles are all lumped together, which would mean that the stock price was very close for all the periods we looked at. The largest positive deviation being on the vesting date 8/15/2020 where there was a $42 delta between V-day and V+7. The largest negative deviation was in the same year on 2/15/2020 with V+7 being $28 lower than V-day.
Let’s now look at the percent difference for each date relative to the price on V-Day.
Here is a quick summary of this data.
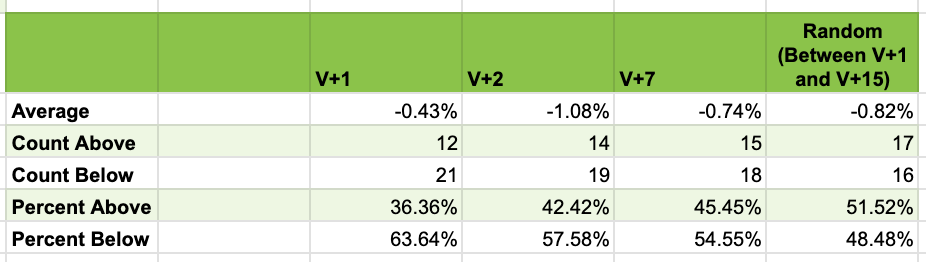
Example of how to read the table:
On average the price of Meta on V+1 is -.43% lower than on V-Day
In 36% of vesting days looked at, the price on V+1 was higher than V-Day.
The average difference seems highest on V+2
To be honest the differences seemed larger than I expected (even though they remain small). Thinking about how I was doing the analysis a little more made me realize that it might not make sense to be using V-Day as the reference date since it is not possible to actually sell on V-Day. Instead we should be looking at the difference relative to V+1, the first day you can actually sell.
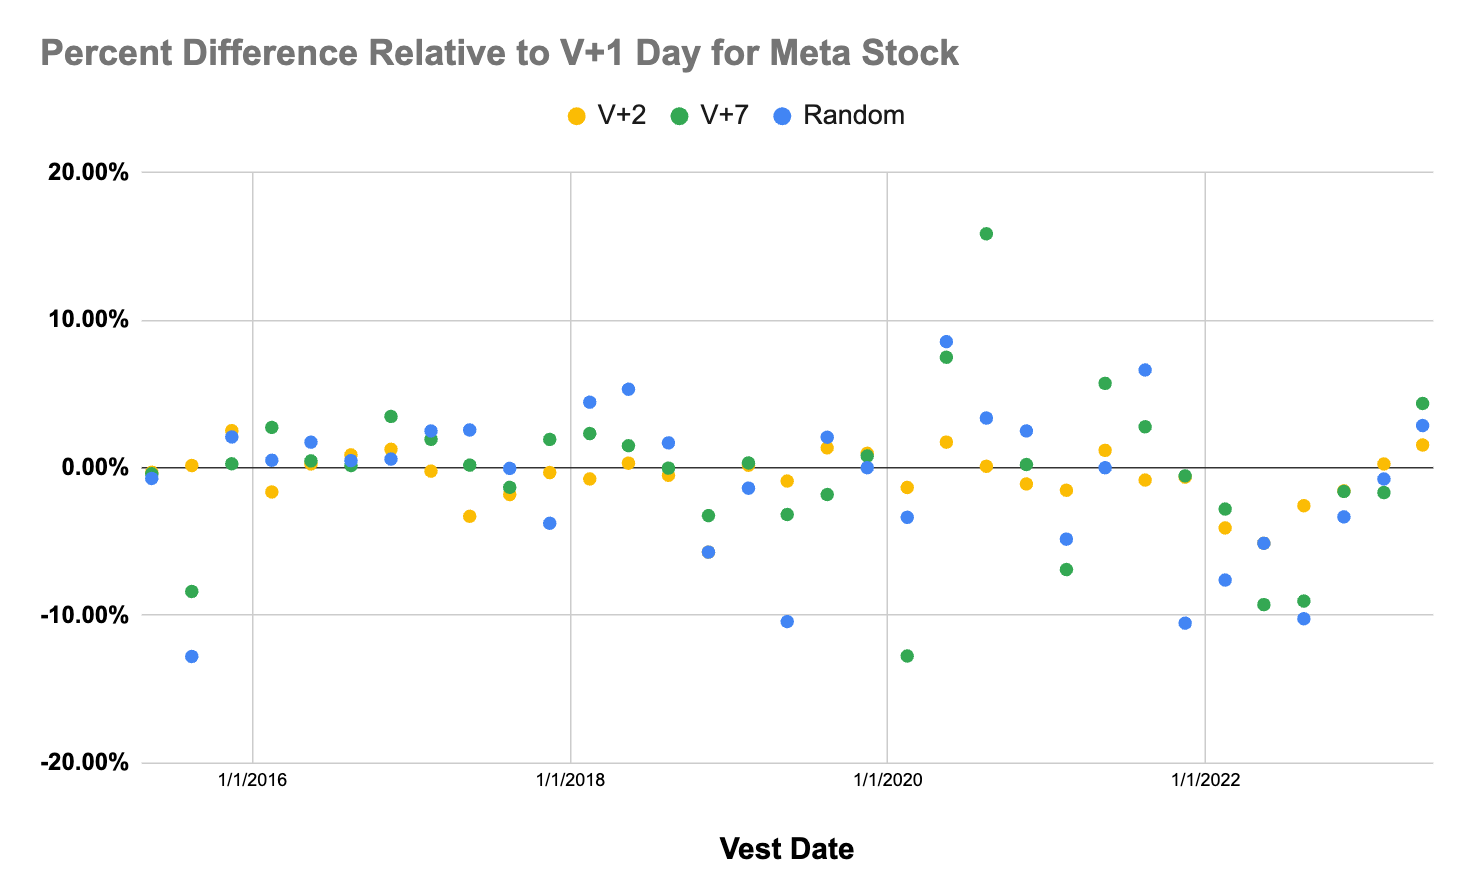
Here is the summary when comparing relative to V+1.

This is much closer to what I had hypothesized. With the numbers beginning to approach the stock being up 50% of the time and down 50% of the time (note the Percent above and below for random includes V+1 which is why those values don’t make as much sense). I may have even expected a slight skew in the positive direction since Meta has generally increased over the 9 years.
Here is a quick look at the distribution for each sale date relative to the price on V+1.
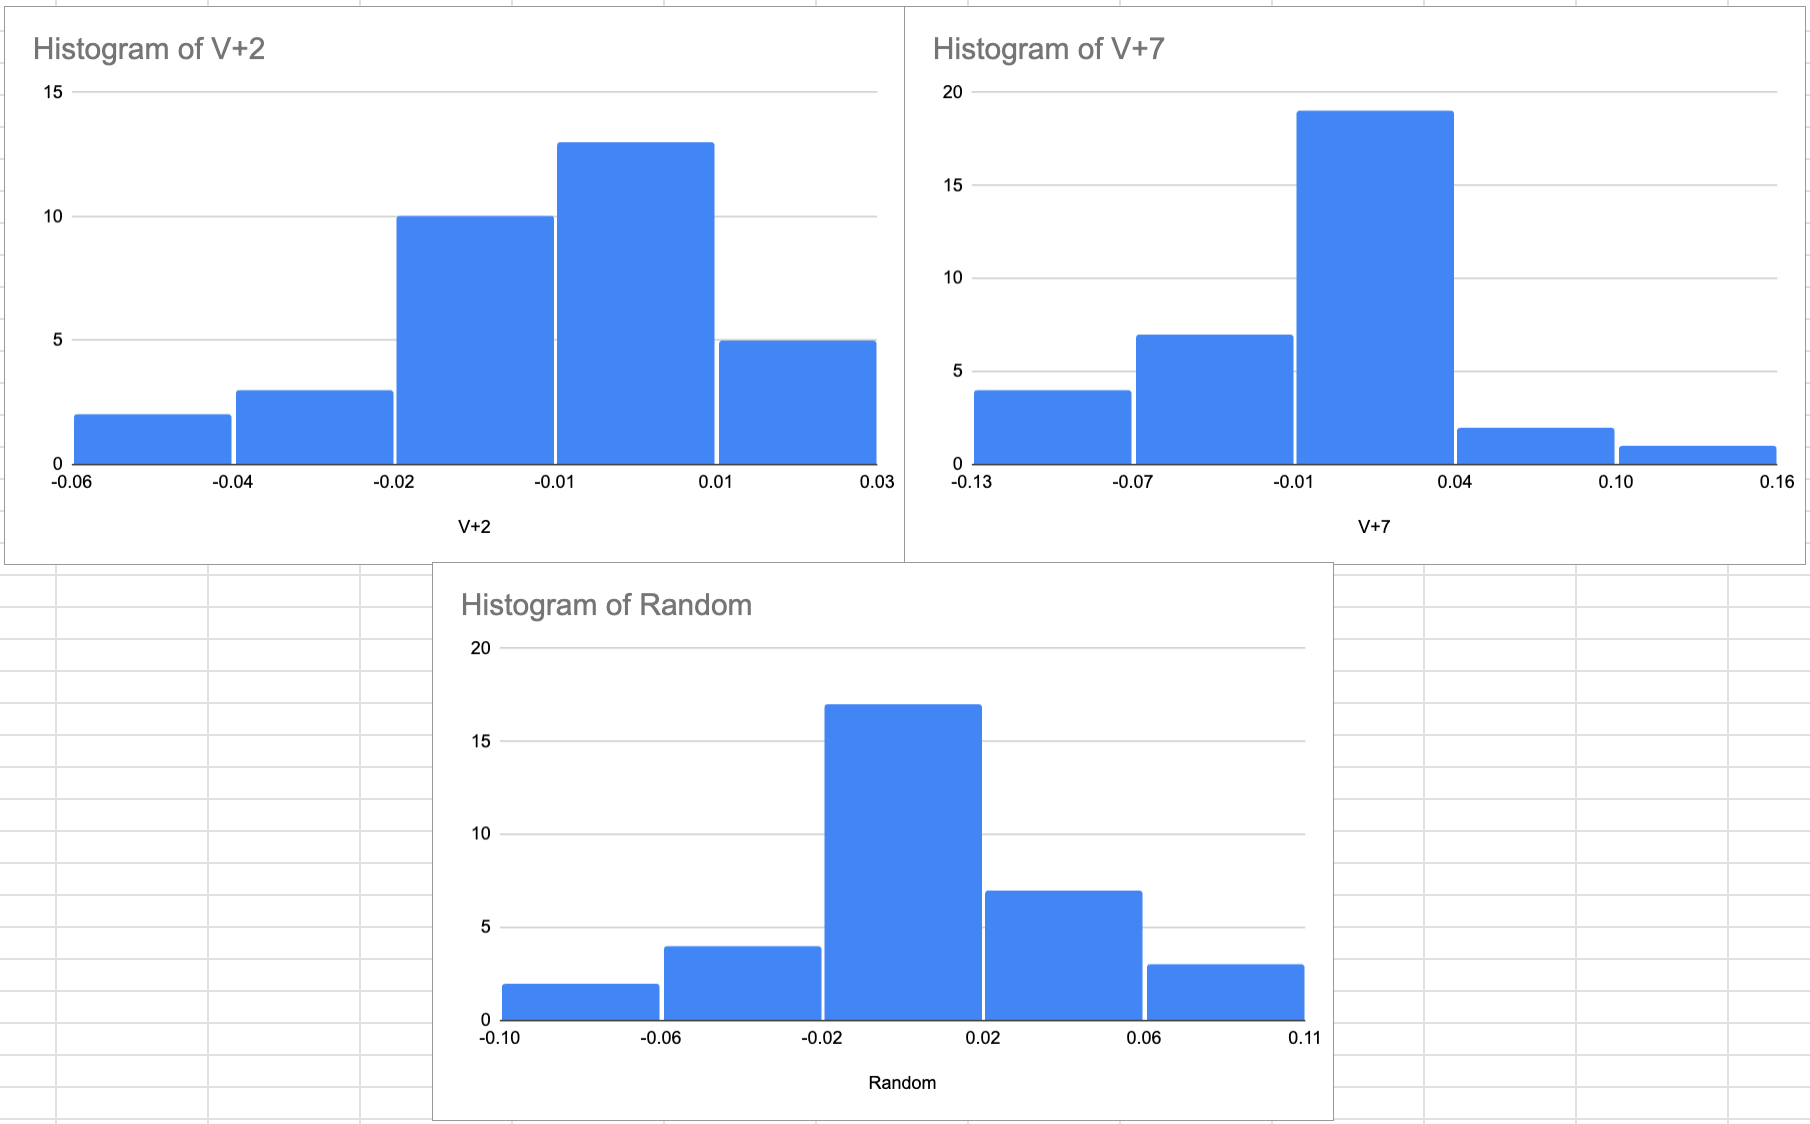
The majority of times there is a very small change in Meta stock price relative to V+1.
What About Portfolio Value Over Time?
Ok… but if the assumption is that you sell, and then diversify into an low cost index fund what is the actual difference in dollar value overtime of different selling dates.
I manually did this analysis for my personal historical vesting since 5/15/2015. Do you know what the difference in end value was across the different strategies?
Comparing V+1 to V+2: V+2 led to a -0.09% difference. (That is -$900 for every $1,000,000)
Comparing V+1 to V+7: V+7 led to a +.56% difference (+$5,600 for every $1,000,000).
Caveats to this methodology: The way I calculated things assumed that after selling your vest you also purchased VTSAX on the same day. In reality there is 2 days for the cash from the sale to settle, and additional days if you transfer your RSU funds to another broker prior to purchasing. Considering how tight the variations are, I really don’t think it would matter too much since you would need to make that same adjustment on each purchase of VTSAX.
This is using 9 years of real world vesting. I am fairly satisfied with this rough analysis to confirm my assumption that “These week to week movements in your RSU values will rarely matter in the long run.”
Let’s look at this one more time with some simulated data. In this example we are going to use the same 9 years worth of vesting but instead of using my personal data the data will look at a static $50,000 worth of Meta vesting every vest period.
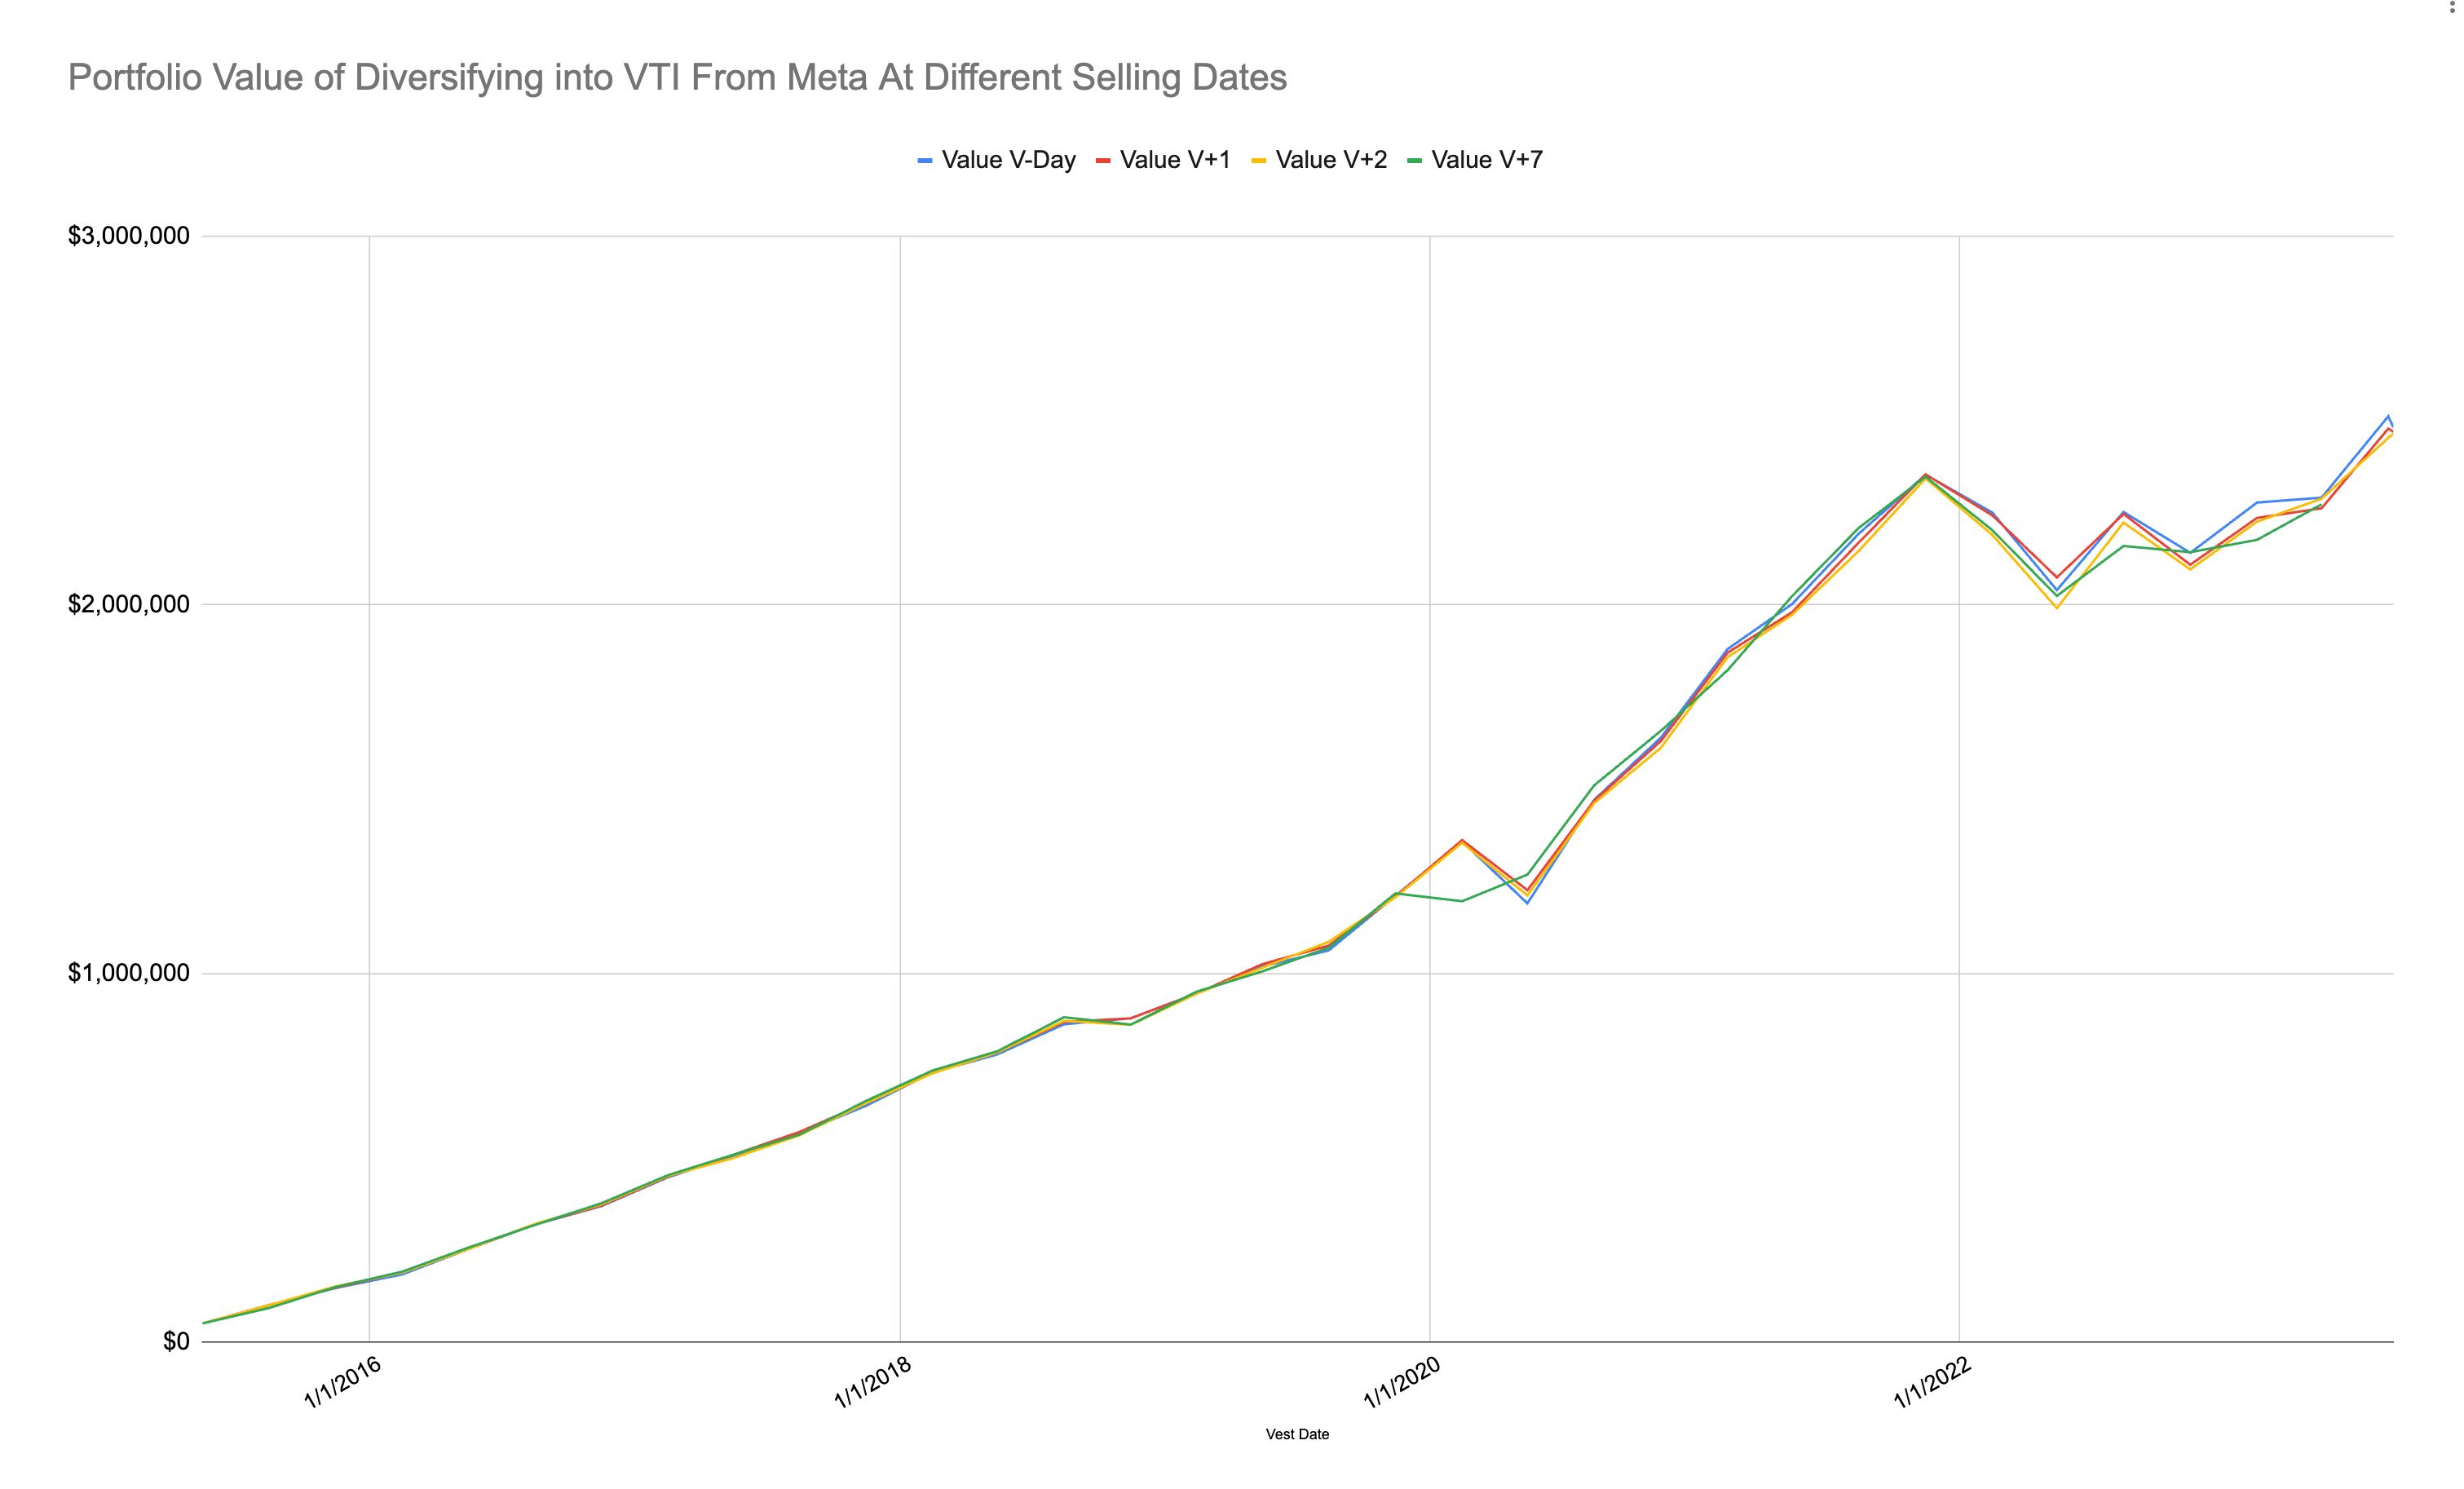
Here are the end values (I removed the most recent vest since we have not reached the V+7 date yet as of this writing).
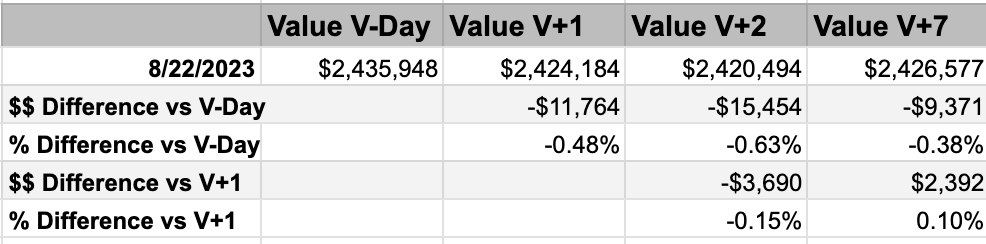
As you can see… it really doesn’t make too much of a difference when during the open trading window you sell.
Curious what you all think? Will you be less stressed about selling right away after this analysis?
Thank you so much for doing such detailed analysis and sharing it.
Andre
Great deal of detailed work here. Thank you. You've reduced my anxiety level around occasionally missing v+2 for sell !