

My Direct Indexing Experience (Year 2)
The Two Year Update on Using Frec's Direct Indexing

It has been almost two years since I started using Frec and their direct indexing products.
Over those two years, I contributed $355,136 to the account, which has now grown to $443,398, while harvesting nearly $45,000 in losses during a bull market.
In this post, I break down exactly how my direct index has performed, how to think about incrementality, and how I’ve been able to use those losses to reduce a concentrated Uber position in my portfolio.
This Post is Sponsored by Frec

Just last month Frec crossed $1 billion in customer assets on the platform.
Frec direct indexing can help you earn more by unlocking tax savings, no matter the market. You can start direct indexing for as little as 0.09%.
FAANG FIRE readers are eligible for a $250 sign up bonus when you join Frec and invest at least $20,000 into one of their Direct Indexing portfolios. Frec also offers Long Short Direct Indexing, and Diversify which can help transition concentrated stocks into a diverse index with minimal tax impact.
Want to Learn More? Join FREC CEO, Mo Al Adham, and me for a FIRE-side chat + Q&A on May 27th at 12pm PT. Register here:
Note: I am a Frec client and Frec paid a one-time fee for this post. I also receive $250 for each referral that uses my link and earns $250 which creates an incentive for me to recommend Frec.
Direct Indexing Recap
Direct Indexing is a strategy where instead of simply buying an index fund like the S&P 500 (VOO), you buy the actual individual shares that make up the index.

Why would you want to do this?
Reason #1 Index Customization
Let’s say you work at Nvidia, Apple, Amazon, Microsoft, Google, or Meta. Each of these companies makes up a meaningful portion of the S&P 500. So every time you buy more VOO, you may also be adding to your unknown concentration risk.
With direct indexing, you can exclude specific companies from your index.
For example, my wife still works at Uber. Because of that, we already have enough Uber exposure, and the stock can only be traded during open trading windows. With my direct index, I can exclude Uber completely instead of accidentally adding more Uber exposure through my index.
I personally try to avoid pretending I am smarter than the market by picking random companies to exclude. But I do think customization can be compelling if you are trying to invest in the broad index while avoiding a specific employer stock, concentrated position, sector, industry, or future IPO exposure if companies like SpaceX, OpenAI, or Anthropic eventually become public and enter major indexes.
For me, capturing market returns while also tax loss harvesting (more on this below) is the main reason. Customization is a useful bonus. The ability to exclude employer stock is the hard requirement.
Reason #2 Tax Loss Harvesting Opportunities
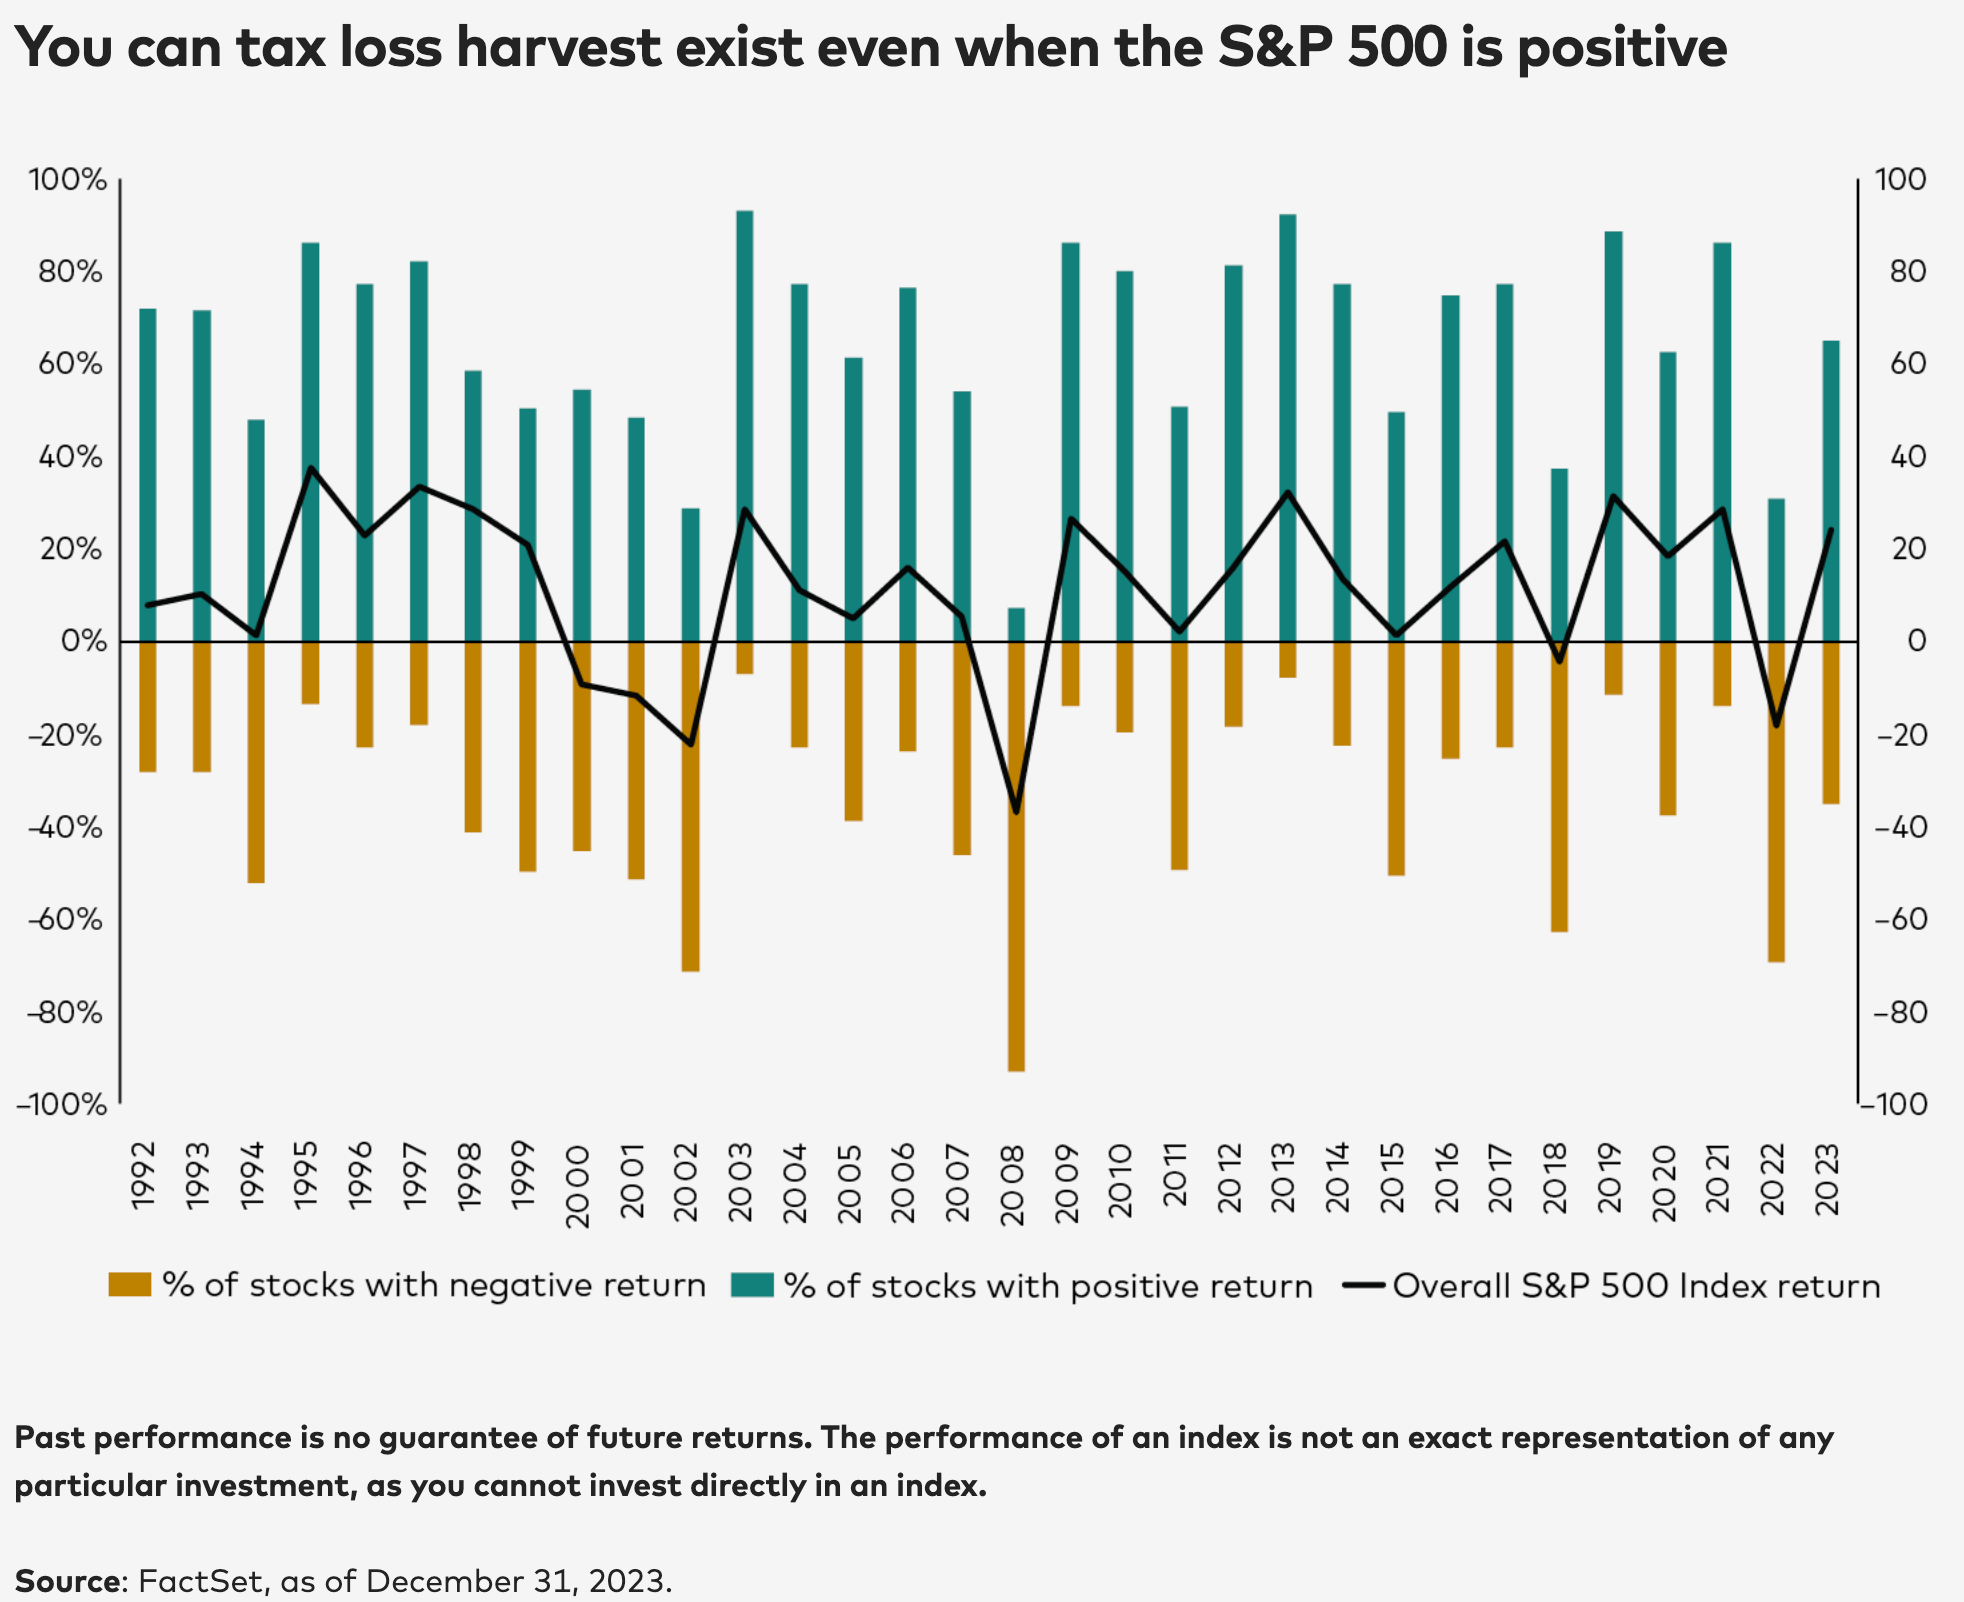
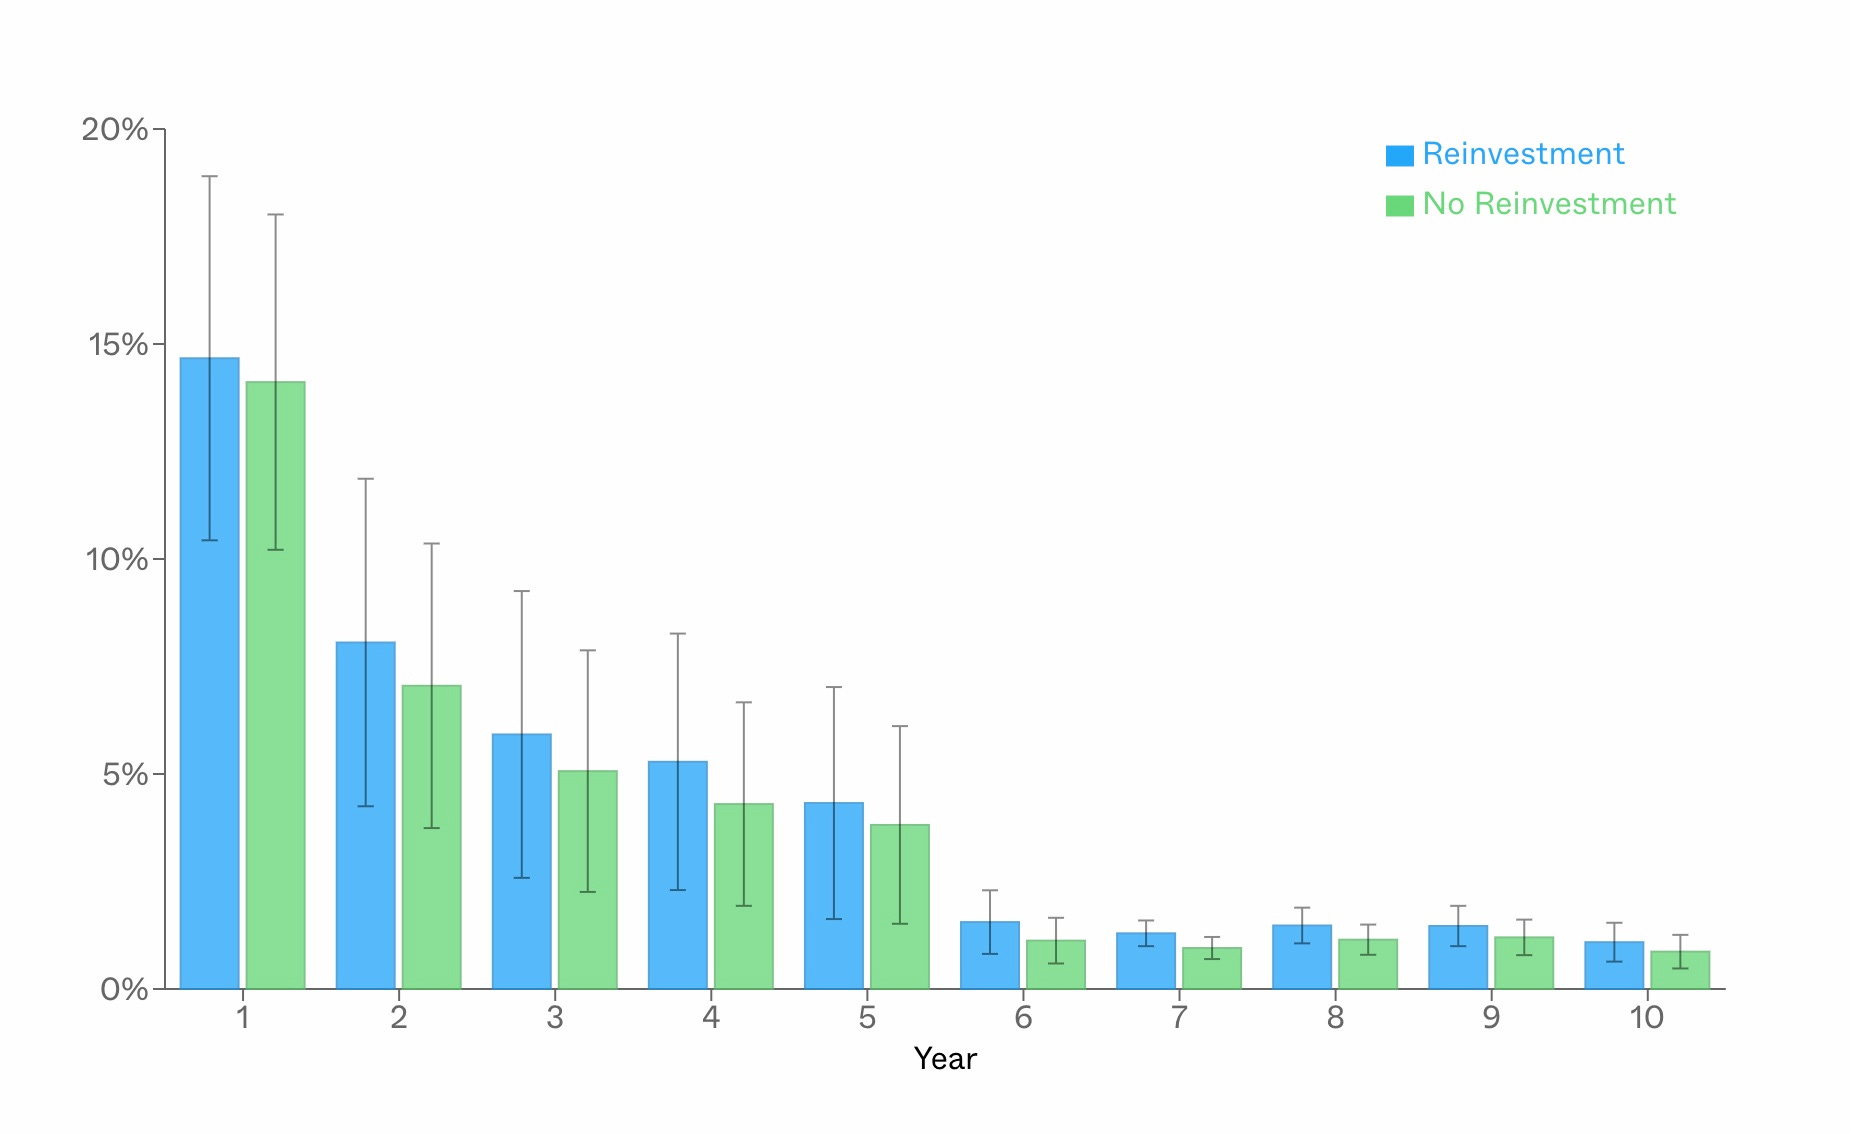
Tax loss harvesting is a strategy where you sell a stock at a loss in a taxable account to offset capital gains or income, potentially reducing your current tax liability. With a direct index holding hundreds of individual positions you drastically increase the number of daily opportunities to harvest losses. Vanguard illustrates this nicely, highlighting that even in years where the S&P 500 is positive, a significant number of the underlying companies are negative.
My personal direct index was able to harvest losses on 315 days since I first started using it in June of 2024, generating $44,388 in realized losses.
This is a key driver of what's often referred to as "tax alpha," or the additional after-tax return that direct indexing can deliver compared to simply owning the equivalent index fund.
Past Posts On Direct Indexing
In June 2024, I started with a $100,000 deposit into Frec’s S&P 500 Direct Index.
In early 2025, I transitioned to Frec’s CRSP US Total Market Index. Frec did not offer this index when I first joined, but it better matches my preference for investing in the total U.S. market rather than only the S&P 500. As part of that transition, I added another $74,000. The additional cash helped me move from the S&P 500 index to the CRSP US Total Market Index without necessarily needing to realize capital gains during the transition.
Since my last post, I have added another $181,136 into my Frec direct index, bringing my total contributions to $355,136.
The May 2026 Update
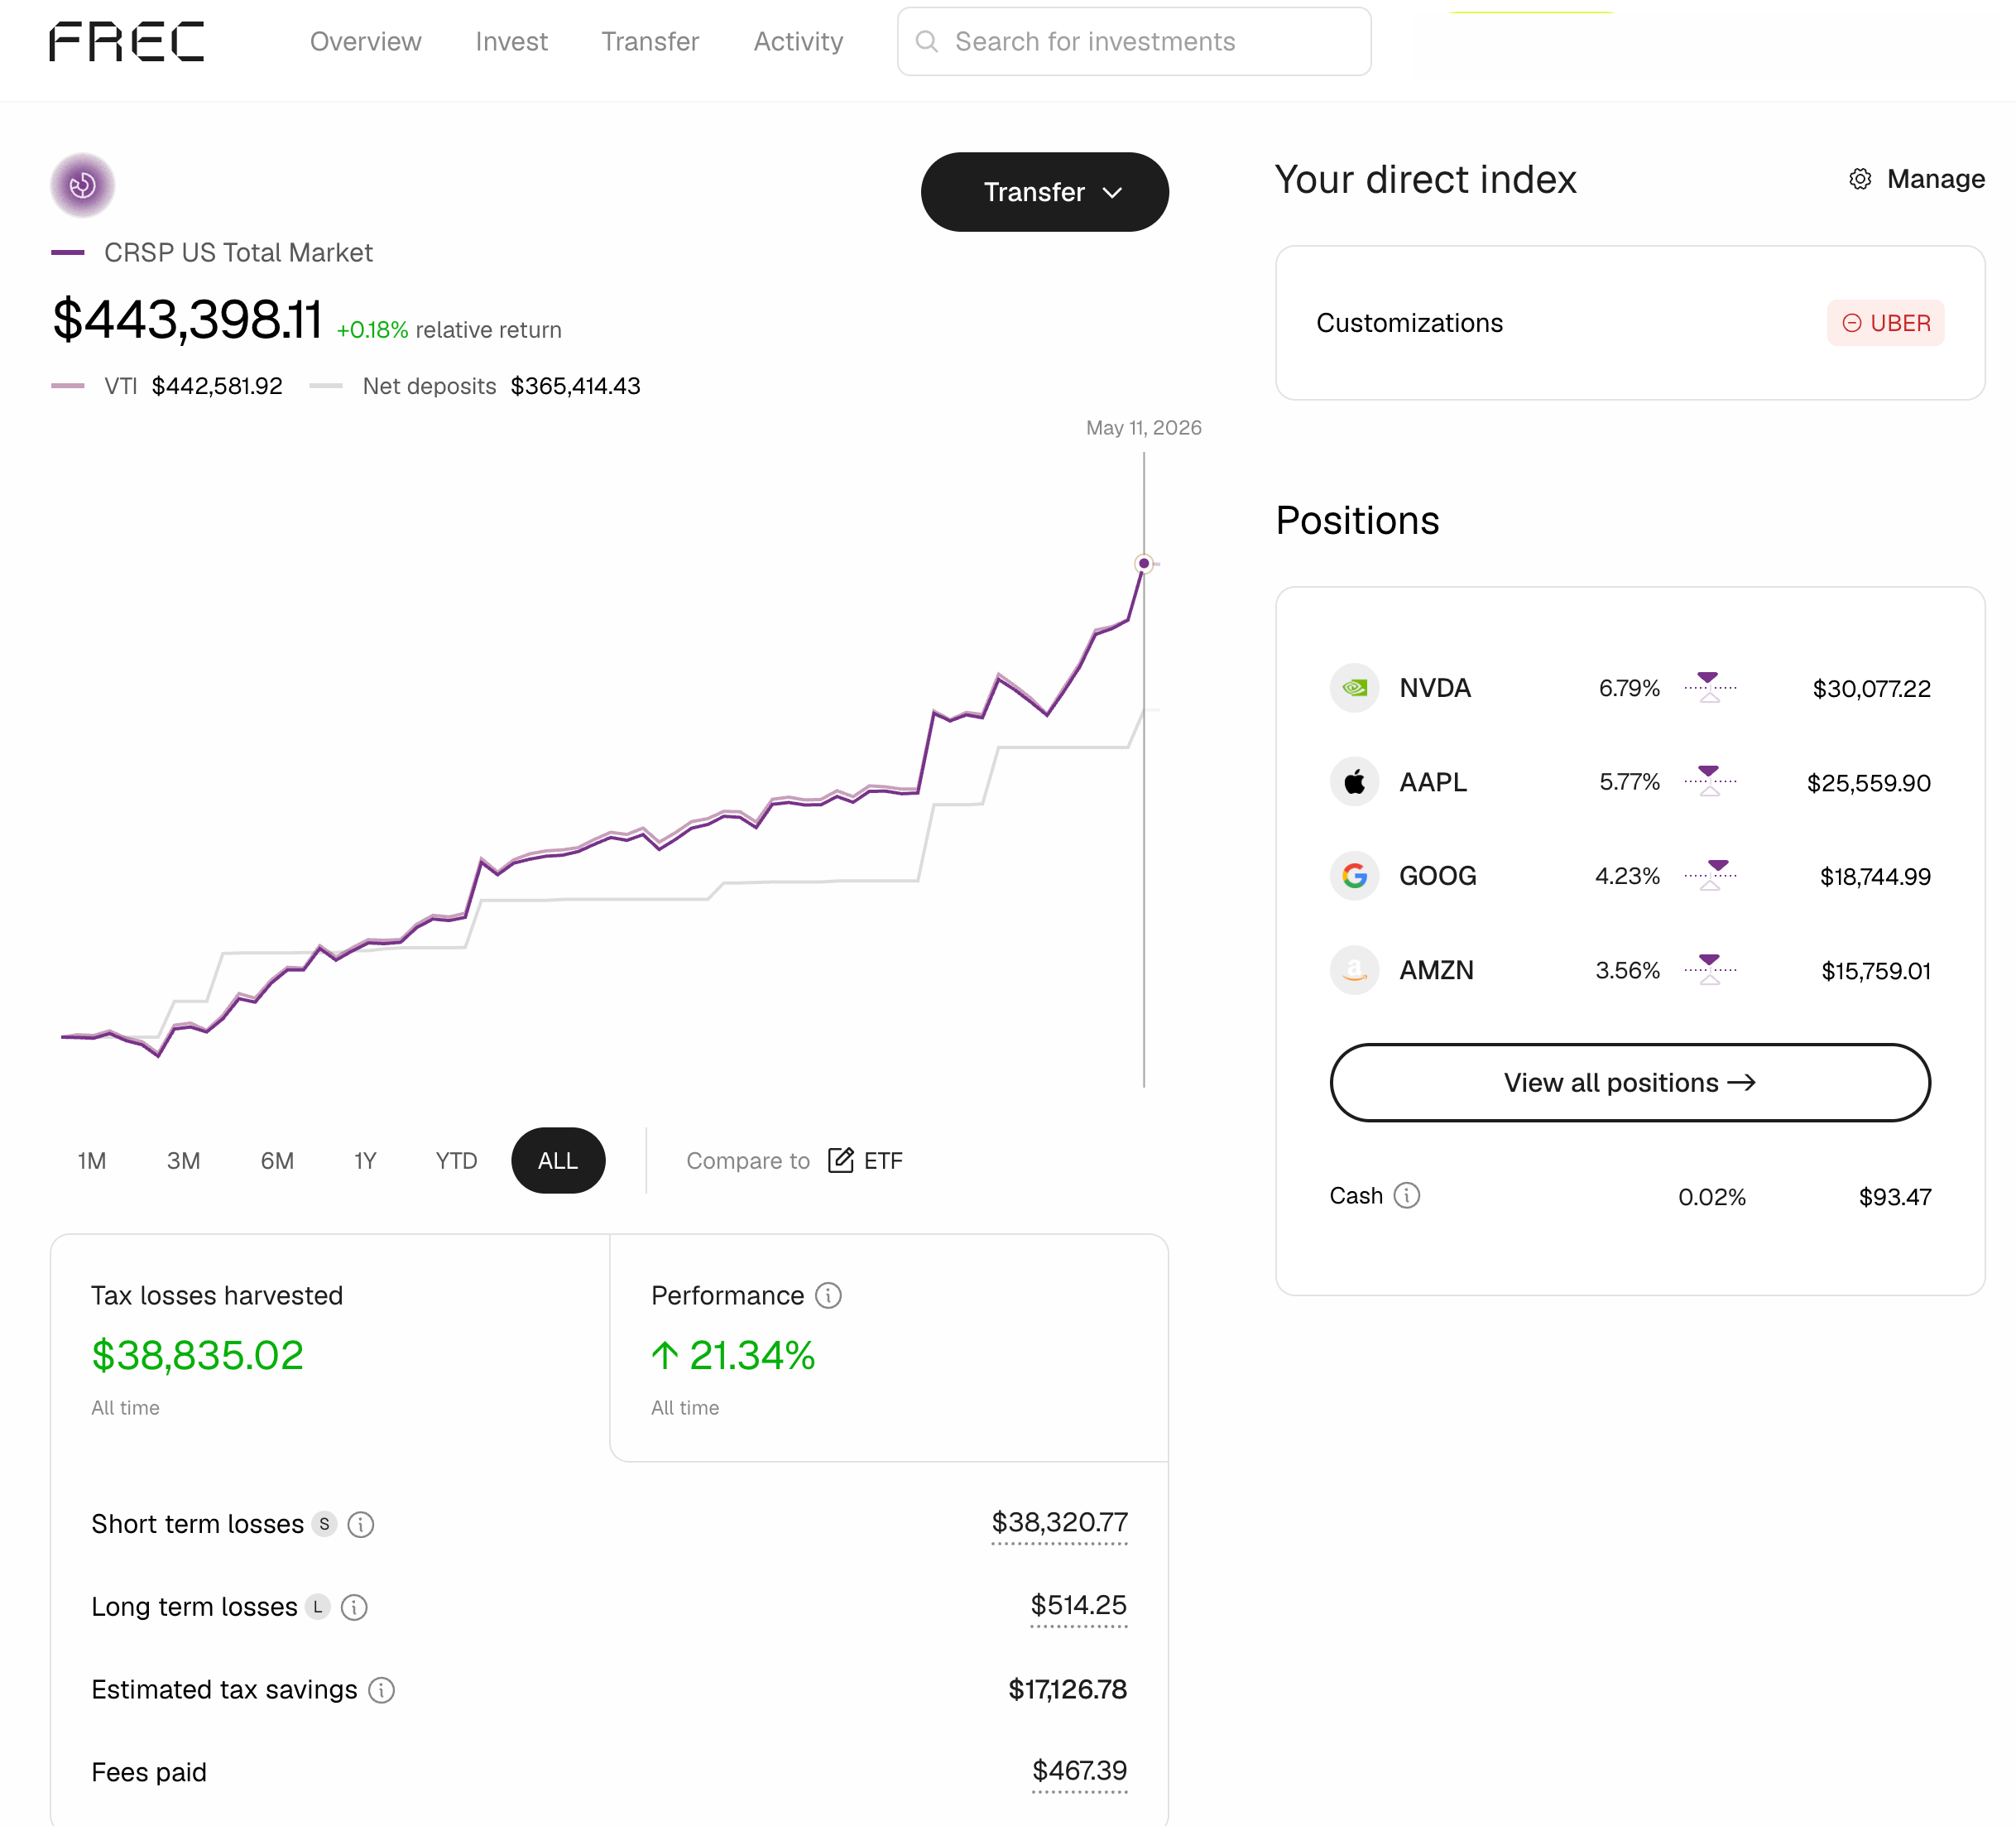
As of May 11, 2026, my Frec portfolio has grown to $443,398.
It has harvested nearly $45,000 in losses, even as the overall market has continued pushing toward new all-time highs. At the same time, the portfolio has continued to closely track its underlying benchmark, VTI.
The Setup
Start Date: June 6th, 2024
End Date (for analysis): May 11th, 2026
Index Tracking:
Originally: S&P 500, Excluding Uber (my wife’s employer)
Current (as of 12/29/2025): CRSP US Total Market Index, Excluding Uber
Portfolio Results
Lifetime Contributions: $355,136
Current Balance: $443,398
Full Period Performance: 24.85%
Money Weighted Returns: 45.65% (21.5% annualized)
Time Weighted Returns: 41.61% (19.7% annualized)
Tax Loss Harvesting
Total Losses Harvested: $44,388
Total Harvest as Percent of Contributions: 12.5%
Estimated Tax Savings (per Frec): $19,645
Based on 35% federal, 20% LTCG, 9.3% California, 3.8% NIIT
Costs and Income
Total Fees: $535.61 (Frec’s CRSP US Total Market direct indexing fee is 0.13%)
Cash Dividends & Interest: $5,204.05 (reinvested)
Past performance is not indicative of future results. Performance shown is for the 6/6/2024 - 5/11/2026 and is presented net of advisory fees. Net performance reflects the deduction of Frec’s AUM fee. Individual client results will vary.
Harvesting Losses in a Bull Market
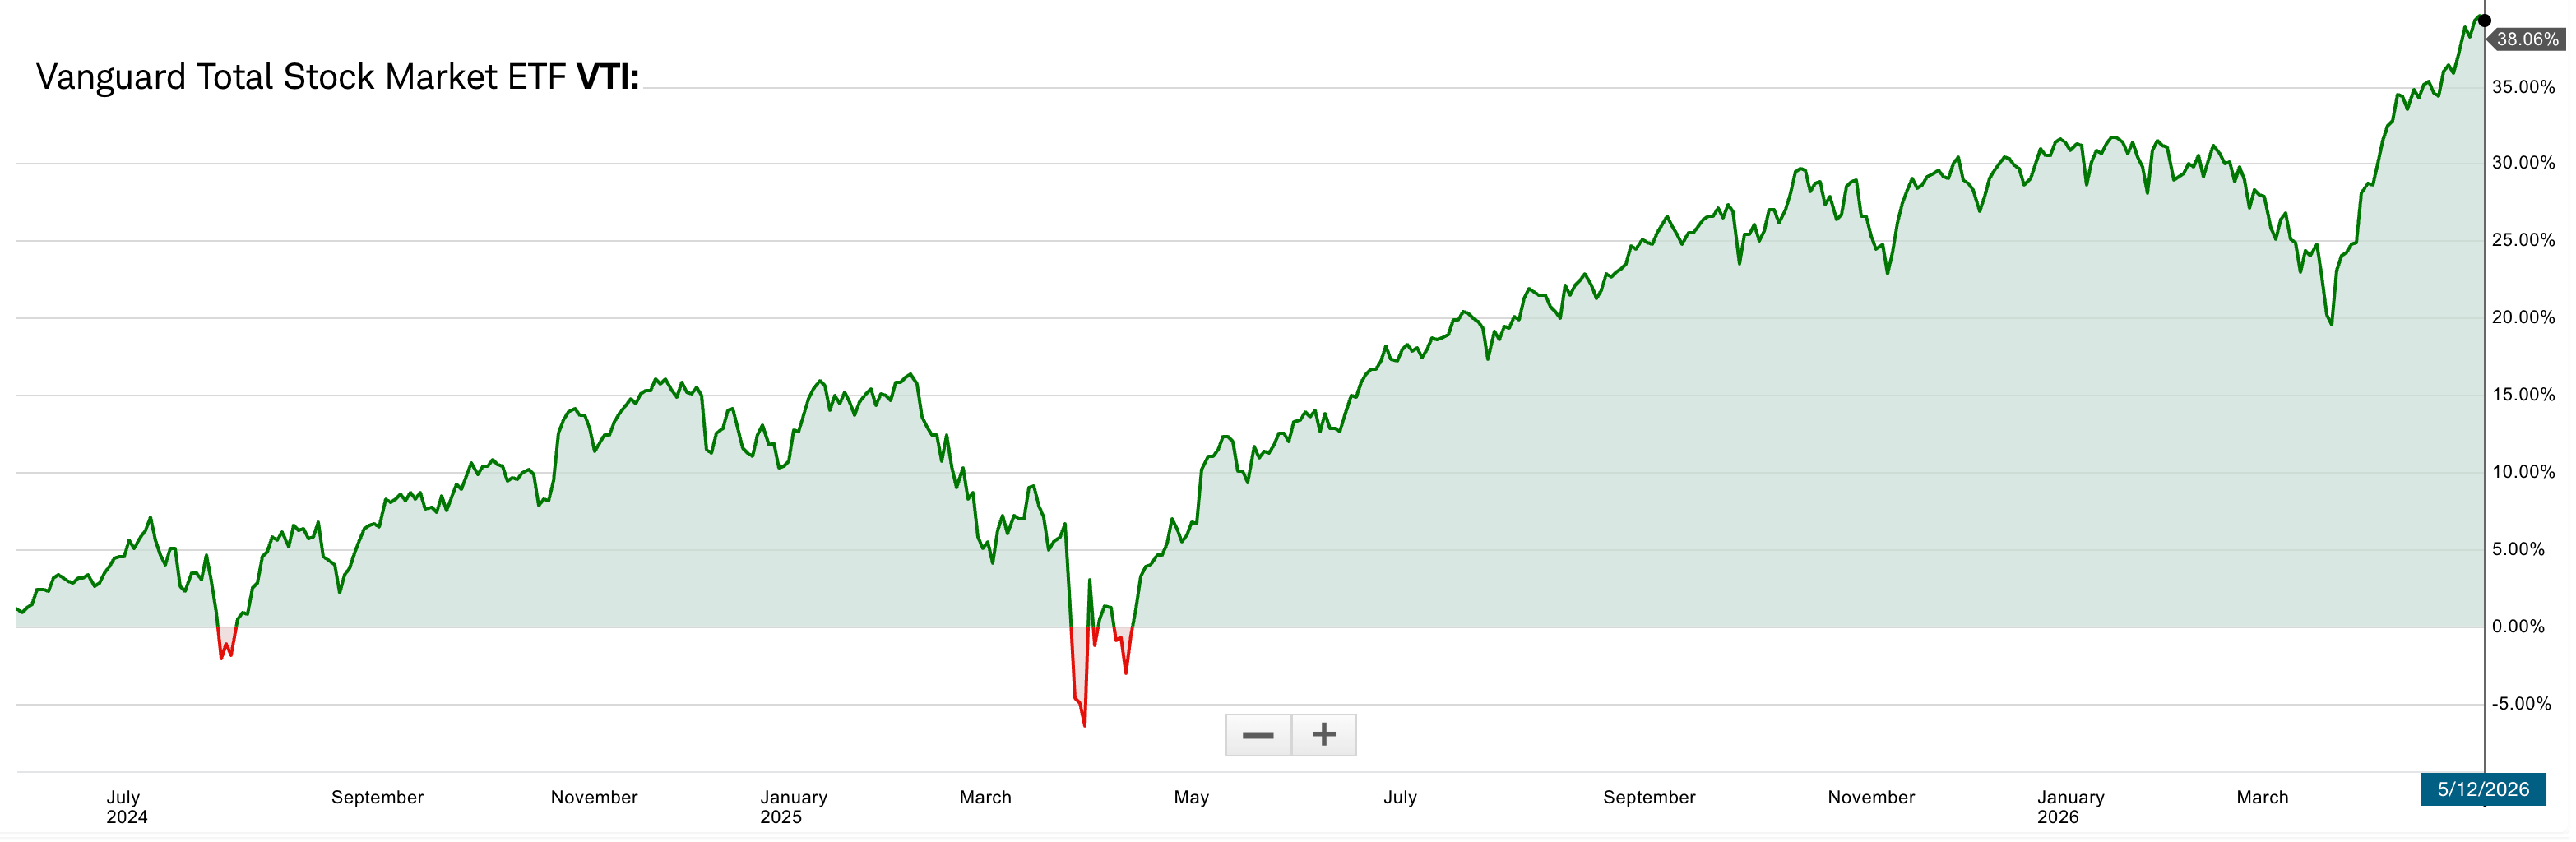
VTI is up 38% since June of 2024 when I started my direct index. It is hard to emphasize how hard it would have been to harvest losses during this crazy bull market.
The reason this is possible is that the index can be up while hundreds of individual stocks inside the index are down at different points along the way. The portfolio harvested $44,388 in net realized losses. You may see $45,873.44 used in some of the charts; that is the value before wash sales.
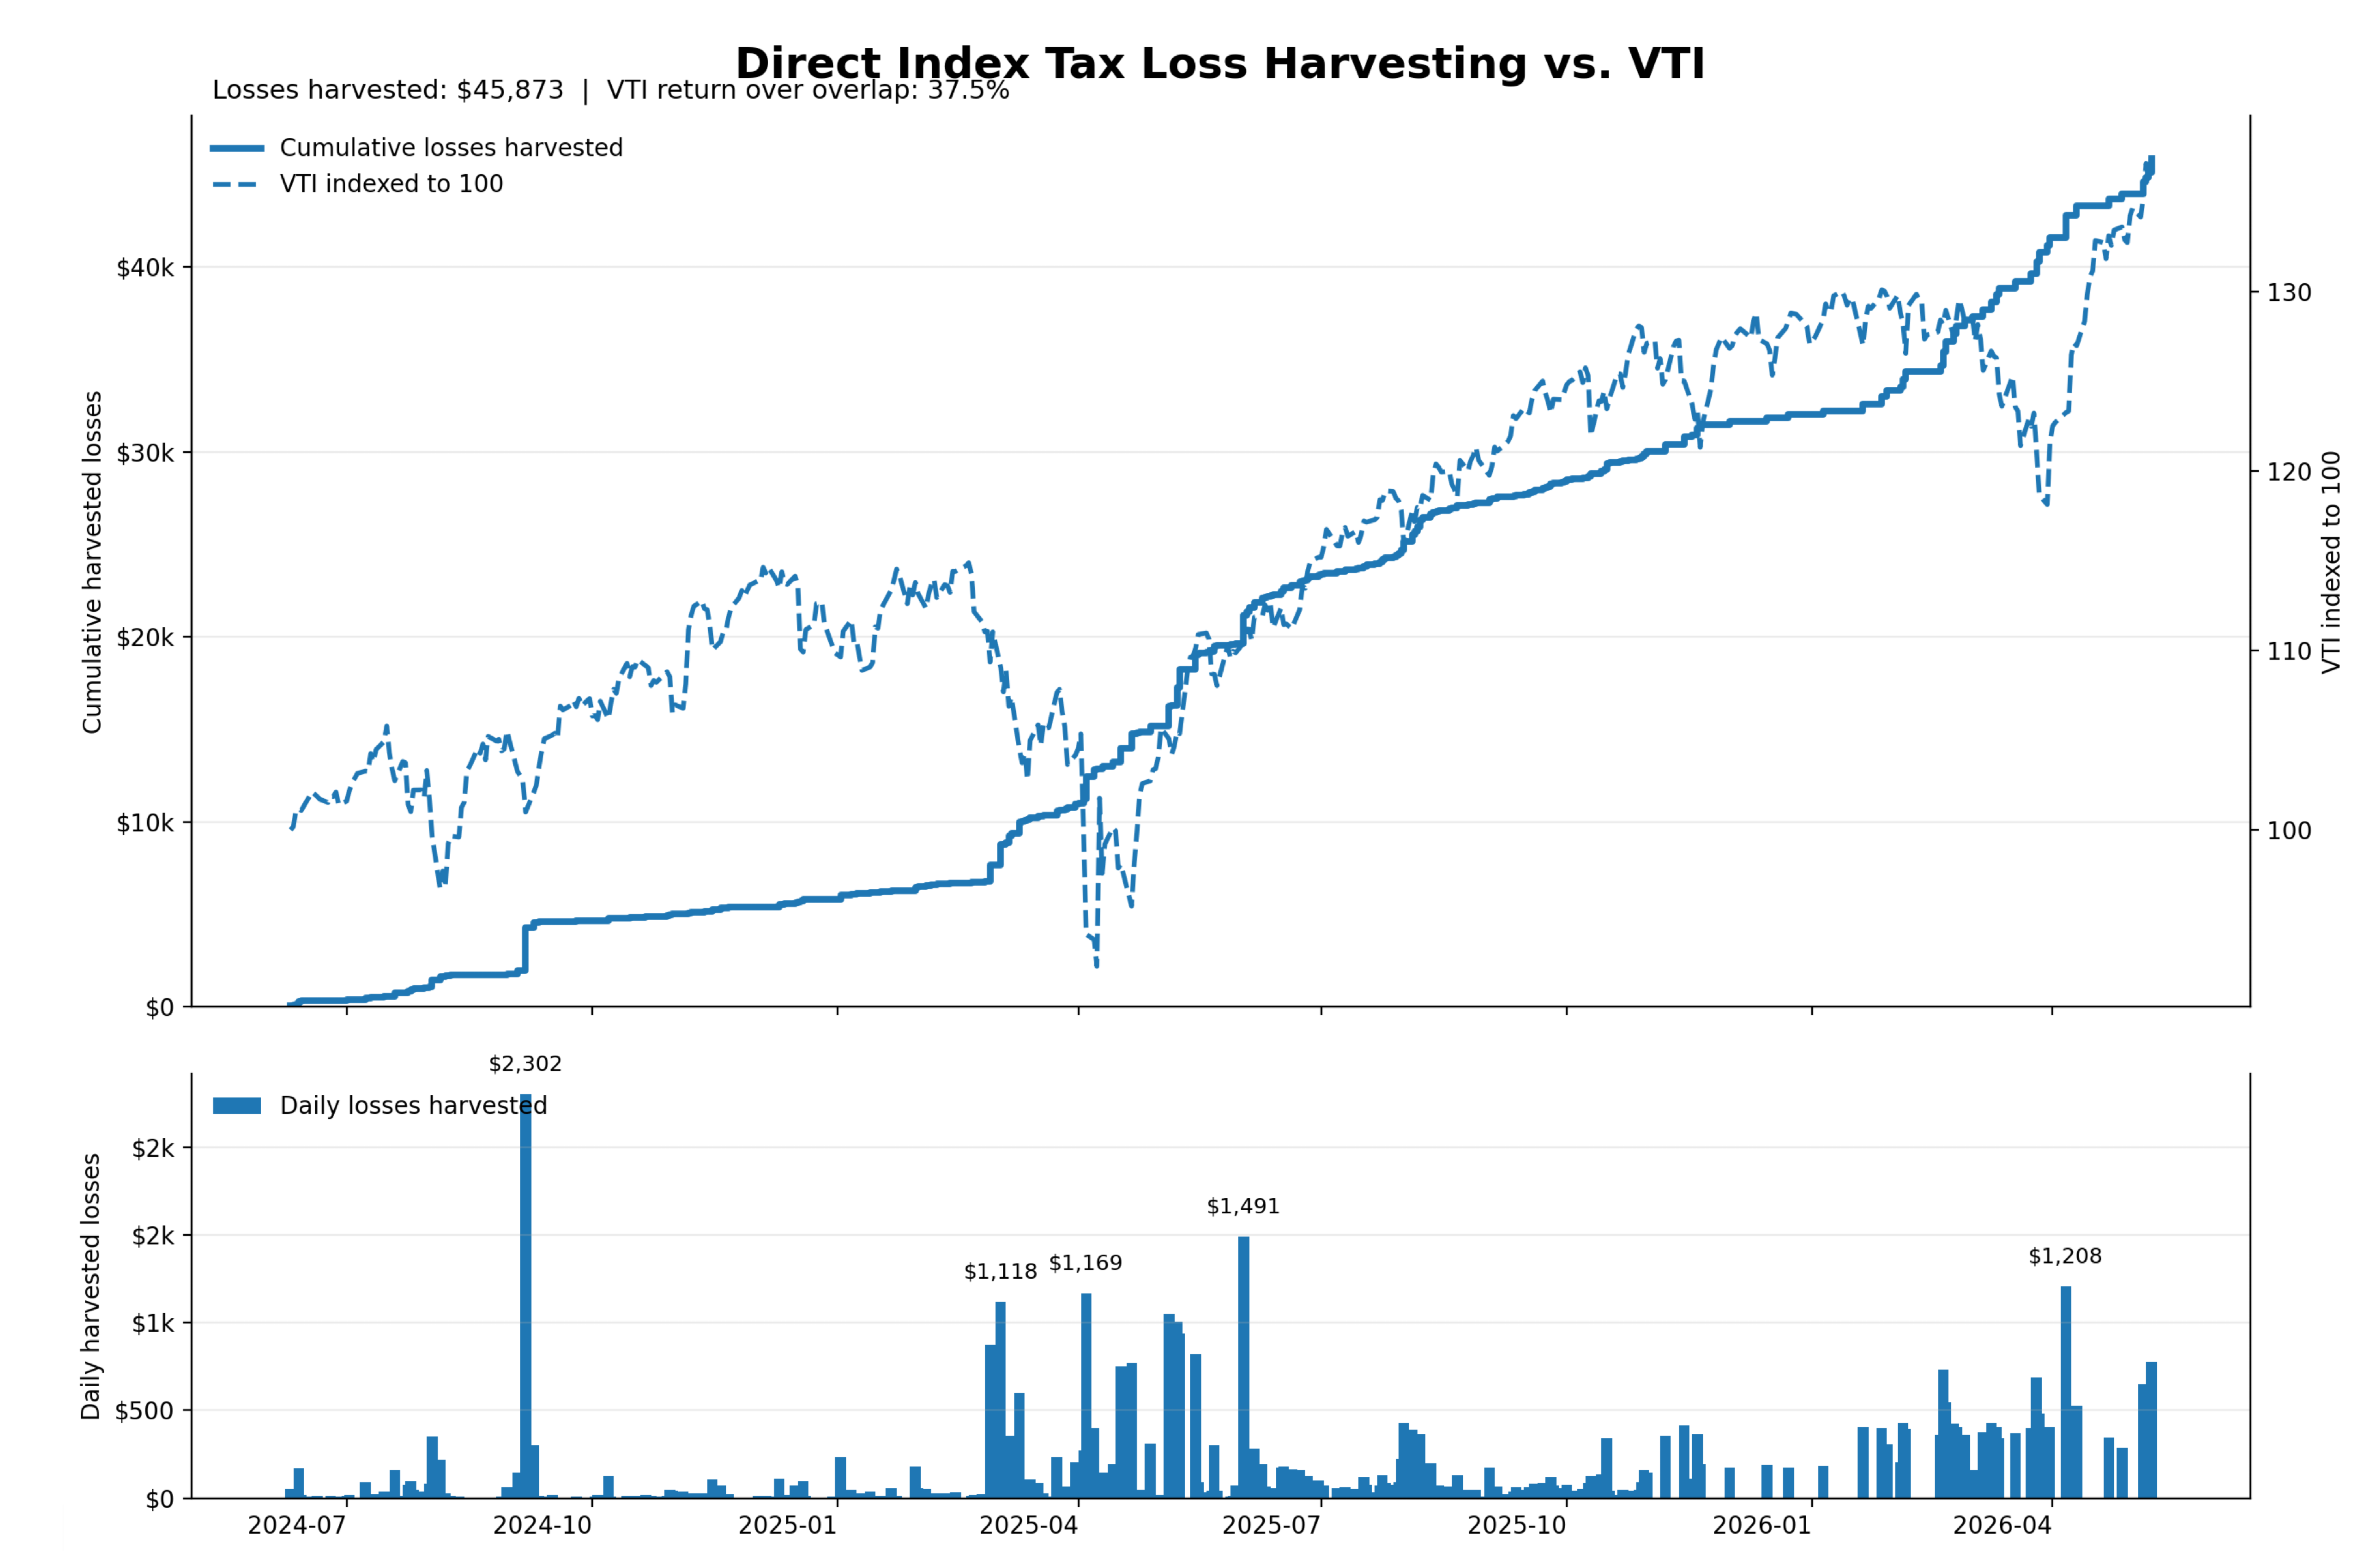
Frec was able to harvest losses steadily even as VTI moved higher. The spikes underneath show that the harvesting was not smooth. A few volatile days did a lot of the work, but smaller daily harvests kept adding up over time.
Should You Explore Direct Indexing?
This is a complicated question.
My honest answer is: It depends.
I still believe that the tax benefits of direct indexing are oversold within the financial community. Harvested losses are not magic free money. That is especially true when other direct indexing providers charge 0.25%, 0.35%, or more1. The higher the fee, the more tax benefit you need just to break even compared to buying a low-cost index fund.
They are most valuable when you have a clear use for them and the benefits outweigh the additional fees and complexity compared to just buying an index fund.
That is where better automation and much lower fees start to matter. A product like Frec becomes far more compelling if you have an immediate or planned use for the losses it creates.
That is precisely my use case.
From my wife’s job, we still have highly appreciated Uber shares. I have always tried to keep any individual stock below my personal 5% portfolio threshold, but after years of doing very little, Uber’s stock finally woke up.
Because of that, I have been able to use every single loss my Frec portfolio has generated. This came after the losses I manually harvested over the past 15 years had finally run dry.
I especially like the use case for people who expect large capital gains in the future. This may be even more relevant if you work at a company where future liquidity is taxed as capital gains, rather than RSUs, which are taxed as income at vest.
That is also where other flavors of direct indexing, including long short strategies that can capture market-like returns while generating additional tax losses, may become more interesting. Mo from Frec will be covering this strategy during our FIRE-side chat.
Further Down the Rabbit Hole
In classic FAANG FIRE fashion, this is the part where I start getting too in the weeds.
It won’t hurt my feelings if you sign up for the FIRE-side chat, like this post, and then close out this email.
The next few sections are for the 27 of you who are a little more curious about what is actually happening under the hood after two years of direct indexing.
I’d also like to thank Brent Sullivan of Tax Alpha Insider for acting as a sounding board for how I was thinking about this. If you are one of the 27 who like this next section, you will very much like Brent’s work. Including our joint semi-dormant podcast where we covered all the various tax strategies for dealing with concentrated positions.

What If I Just Bought VOO and VTI?
Let’s begin our journey into the weeds by attempting to evaluate in more detail how Frec has performed relative to my typical approach of buying index funds.
Frec says historically their simulation results have found an S&P 500 index to remain either above or below the index by a maximum of 0.77% per year2.
In theory, Frec’s provided “relative return” should have answered the question around “What if I just bought VOO and VTI?”. The challenge though, is that I switched indexes and the data within Frec doesn’t continue cleanly across all time periods.
In the UI I can see the ”relative return”, which fluctuates day to day, but has rarely been outside that .77% threshold overall.
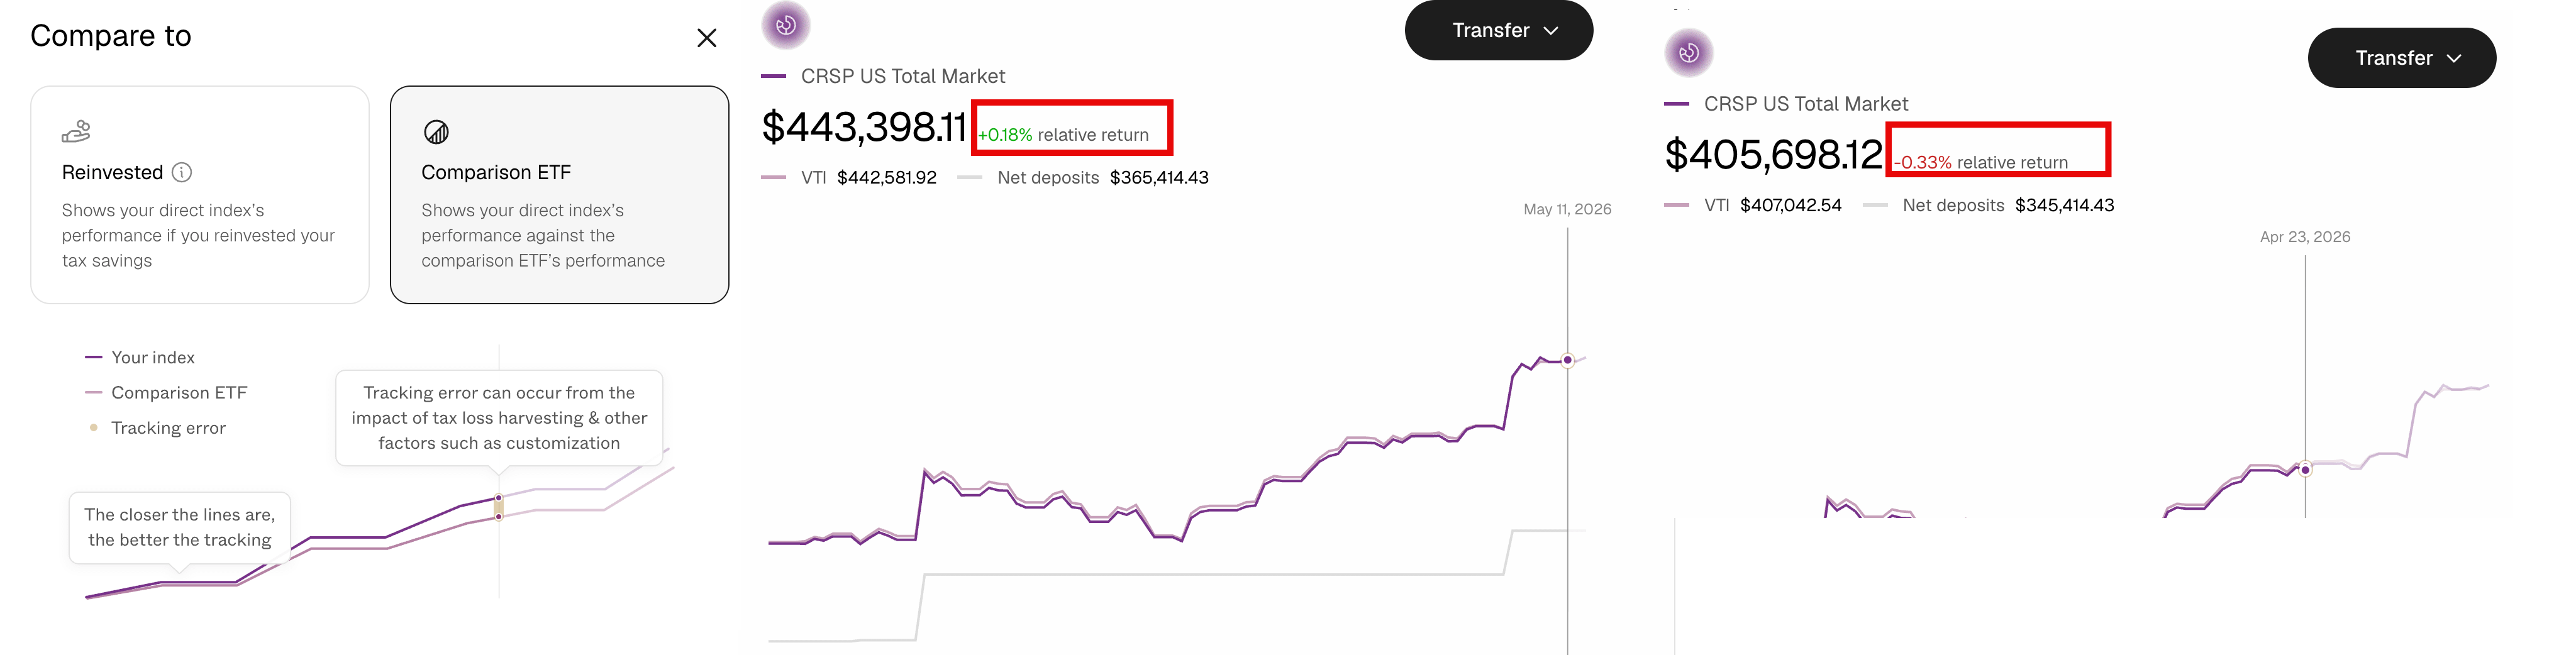
But this is supposed to be a rabbit hole… not a UI walkthrough.
Naturally… let’s try to see if we can answer “What If I Just Bought VOO and VTI?” manually. How hard could it be?
The first step was reconstructing every single tax lot. Which involved translating every single deposit into FREC into an equivalent VTI or VOO buy. It also involved manually computing the reinvestment of dividends within VTI and VOO. This all took an embarrassingly long time.
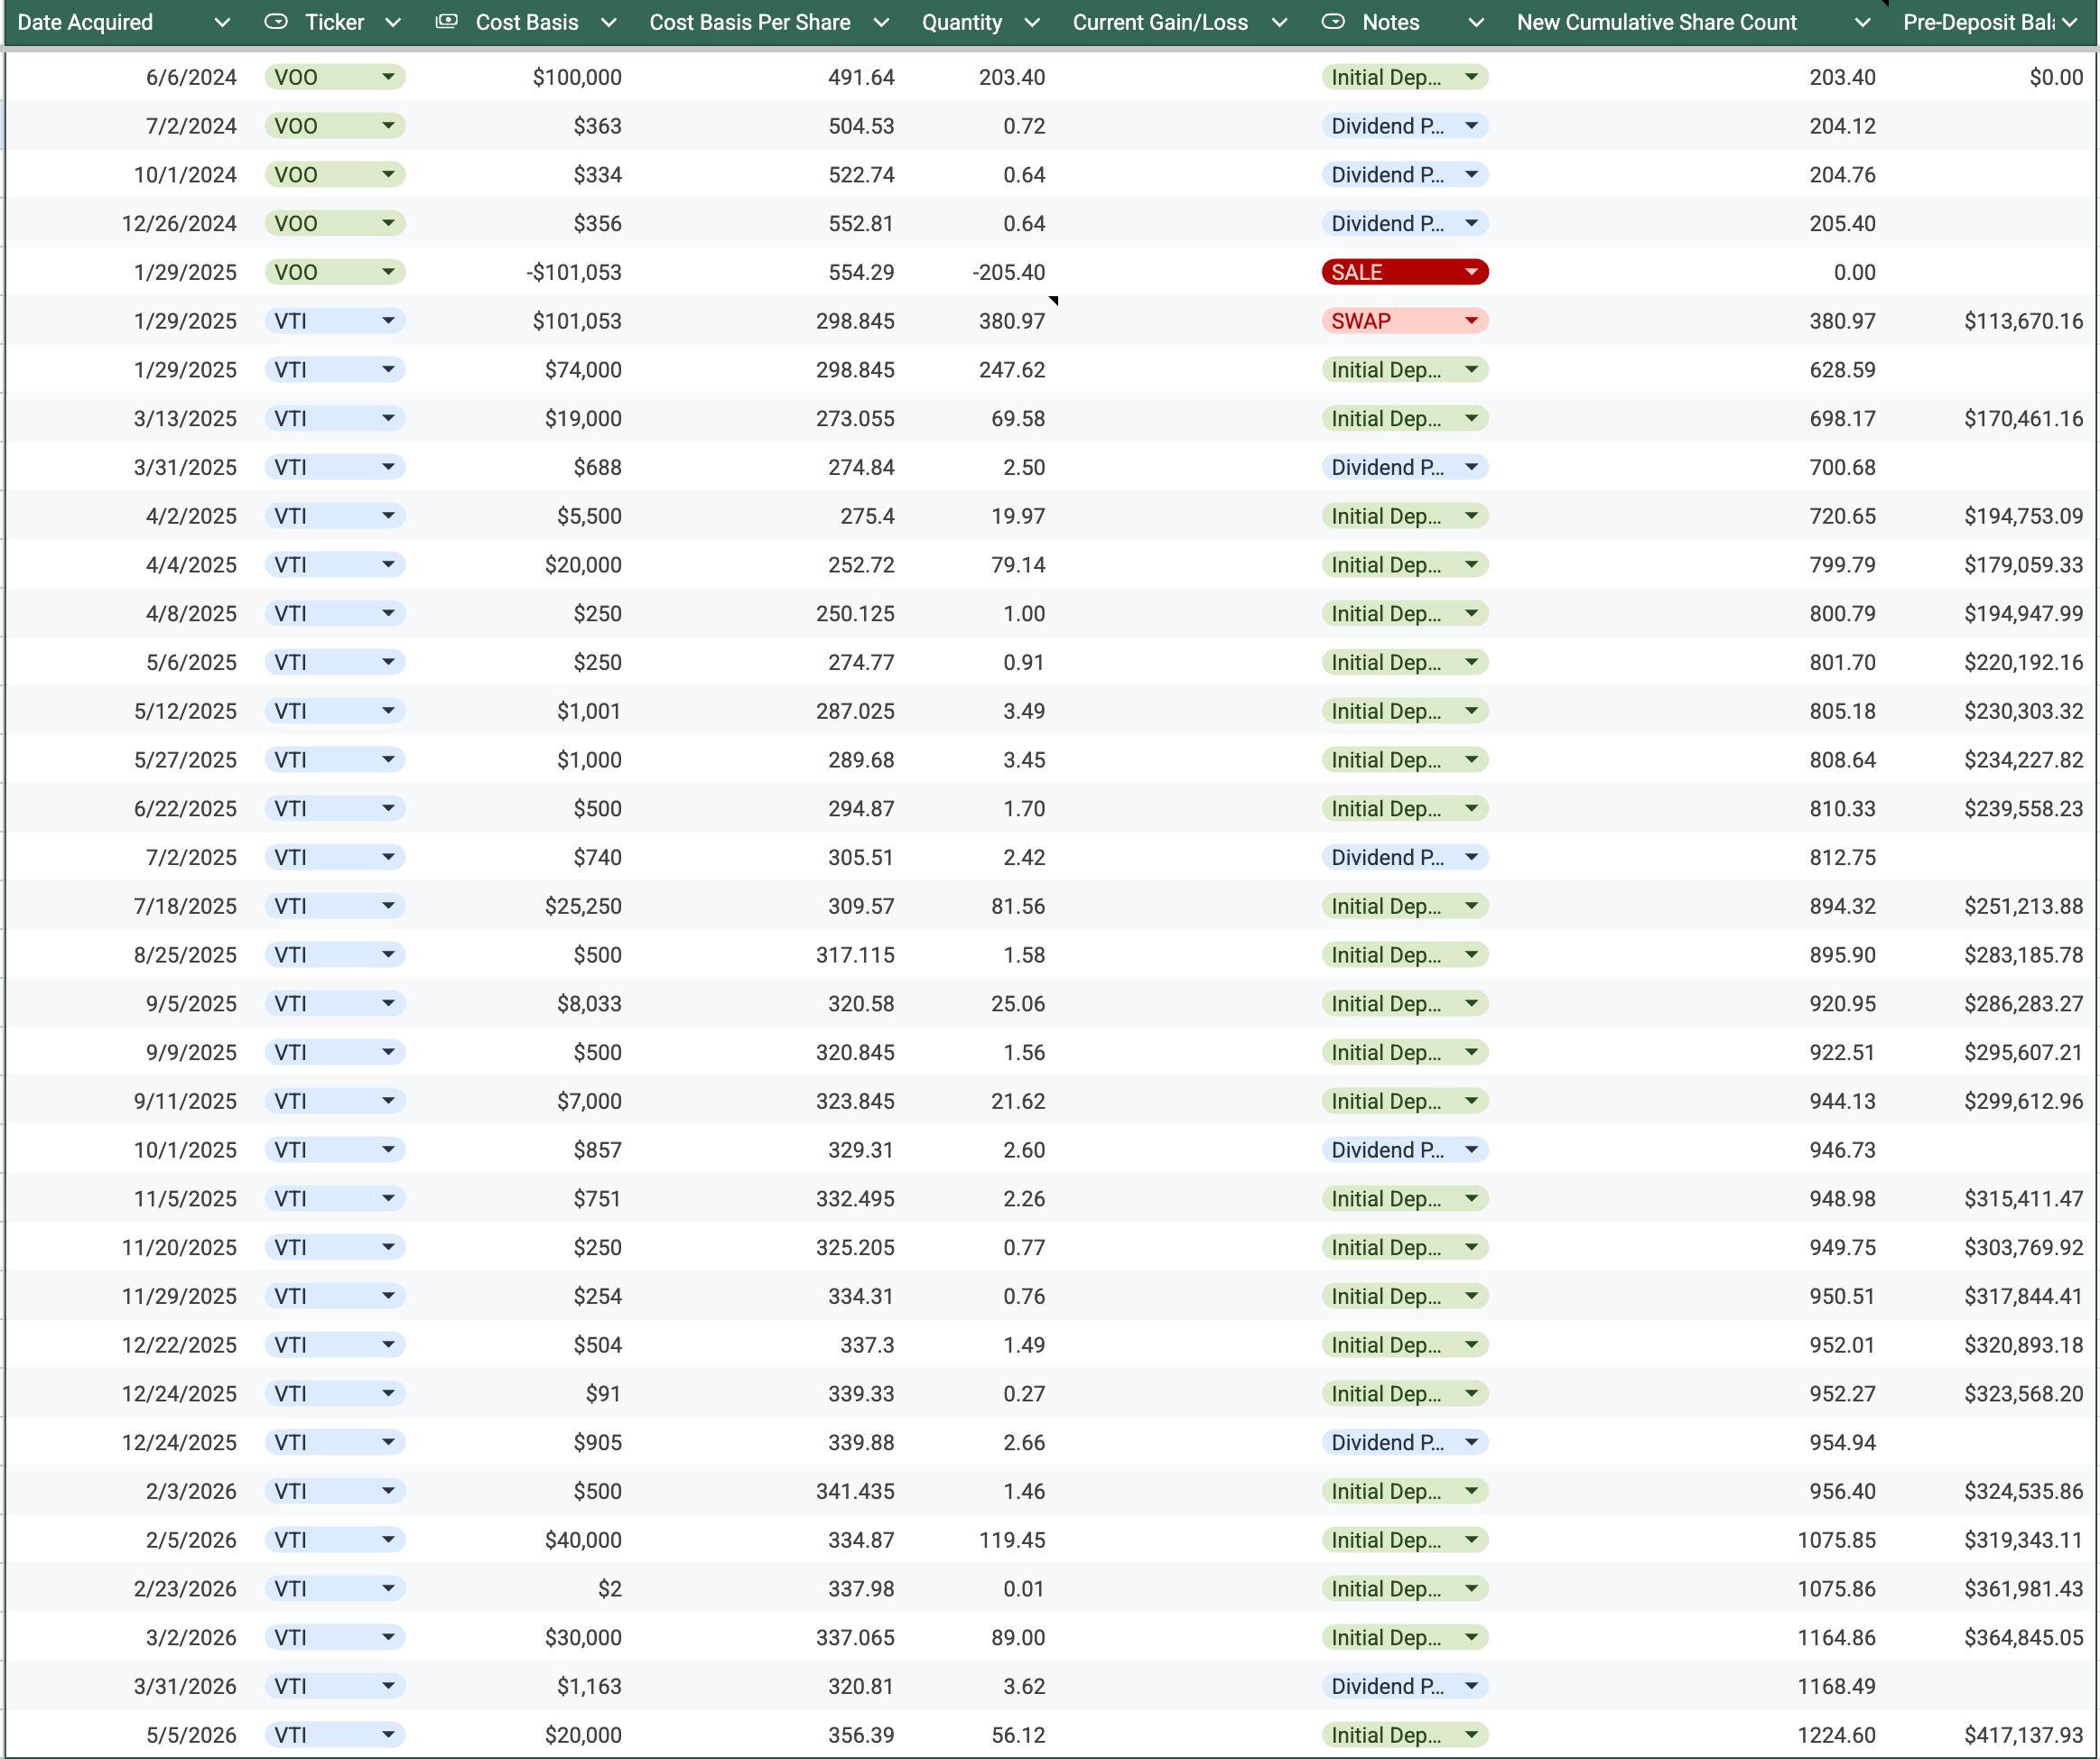
Thankfully most AI tools are now capable of math. That allows us to “quickly” compute this fun table:
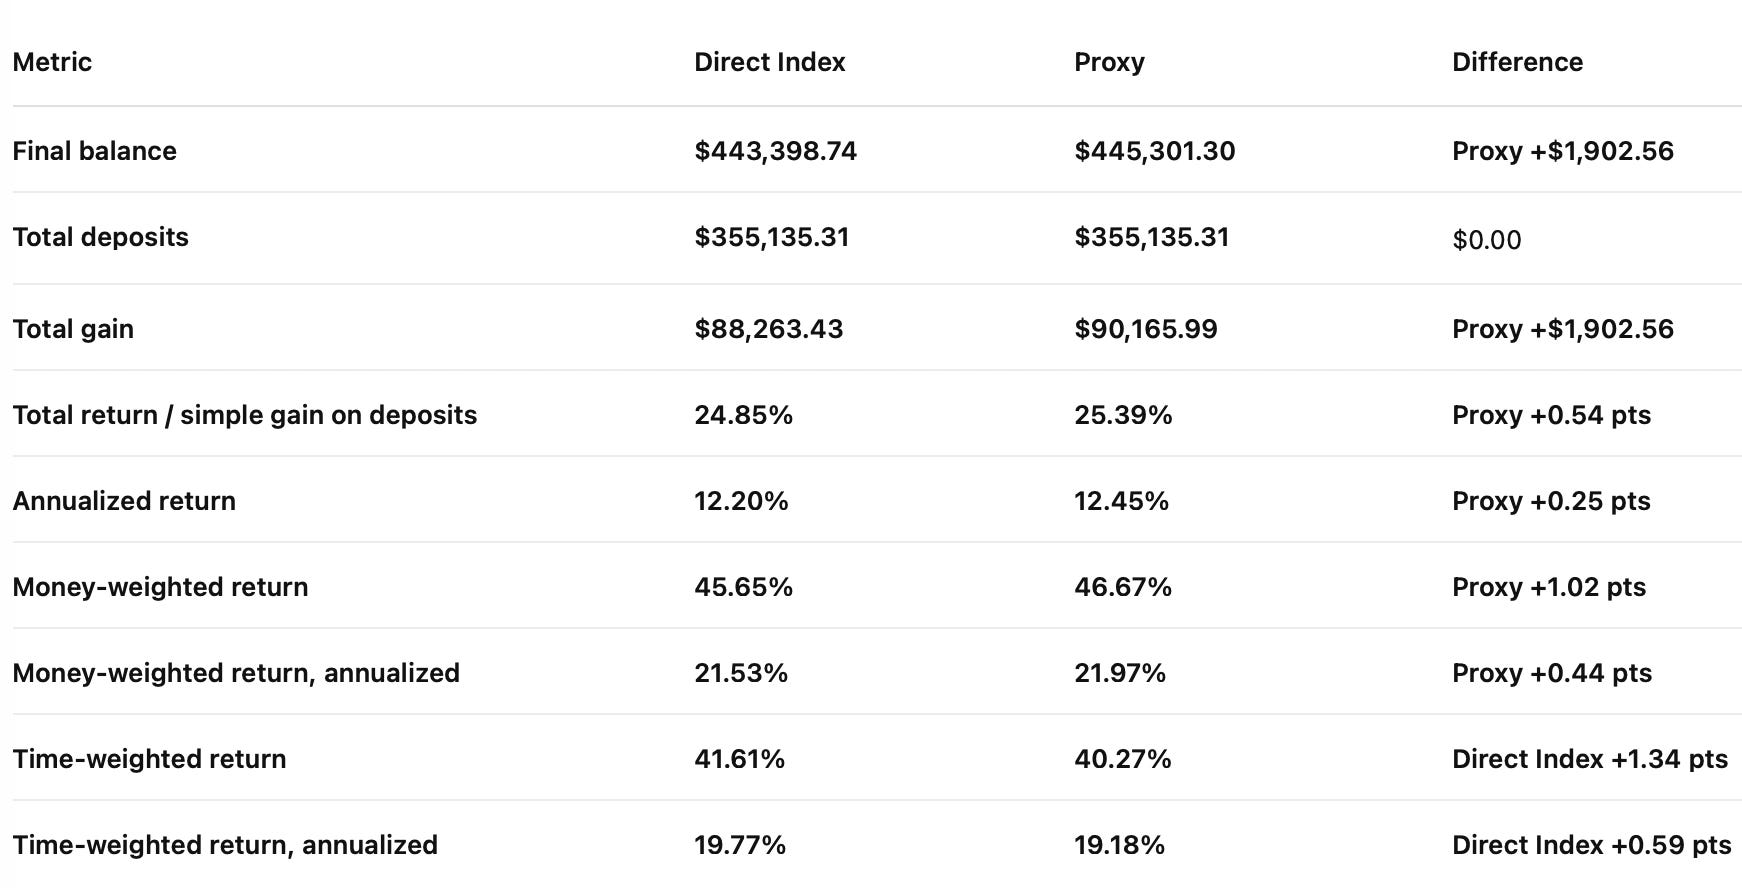
This is saying that the proxy VTI and VOO portfolio came out an entire $1,902.56 ahead, 0.4% of the direct index. Very important to point out that my Frec portfolio excludes Uber which makes up 0.24% of VTI.

Uber is up ~10% over the entire time period, so probably around $100 of the delta could be from that. The rest is likely the random day to day drift. This fluctuates daily, just like the data directly within Frec, but it is nice to have an additional data point.
That gives me the ability to make a nice little comparison of Frec vs a Proxy index:
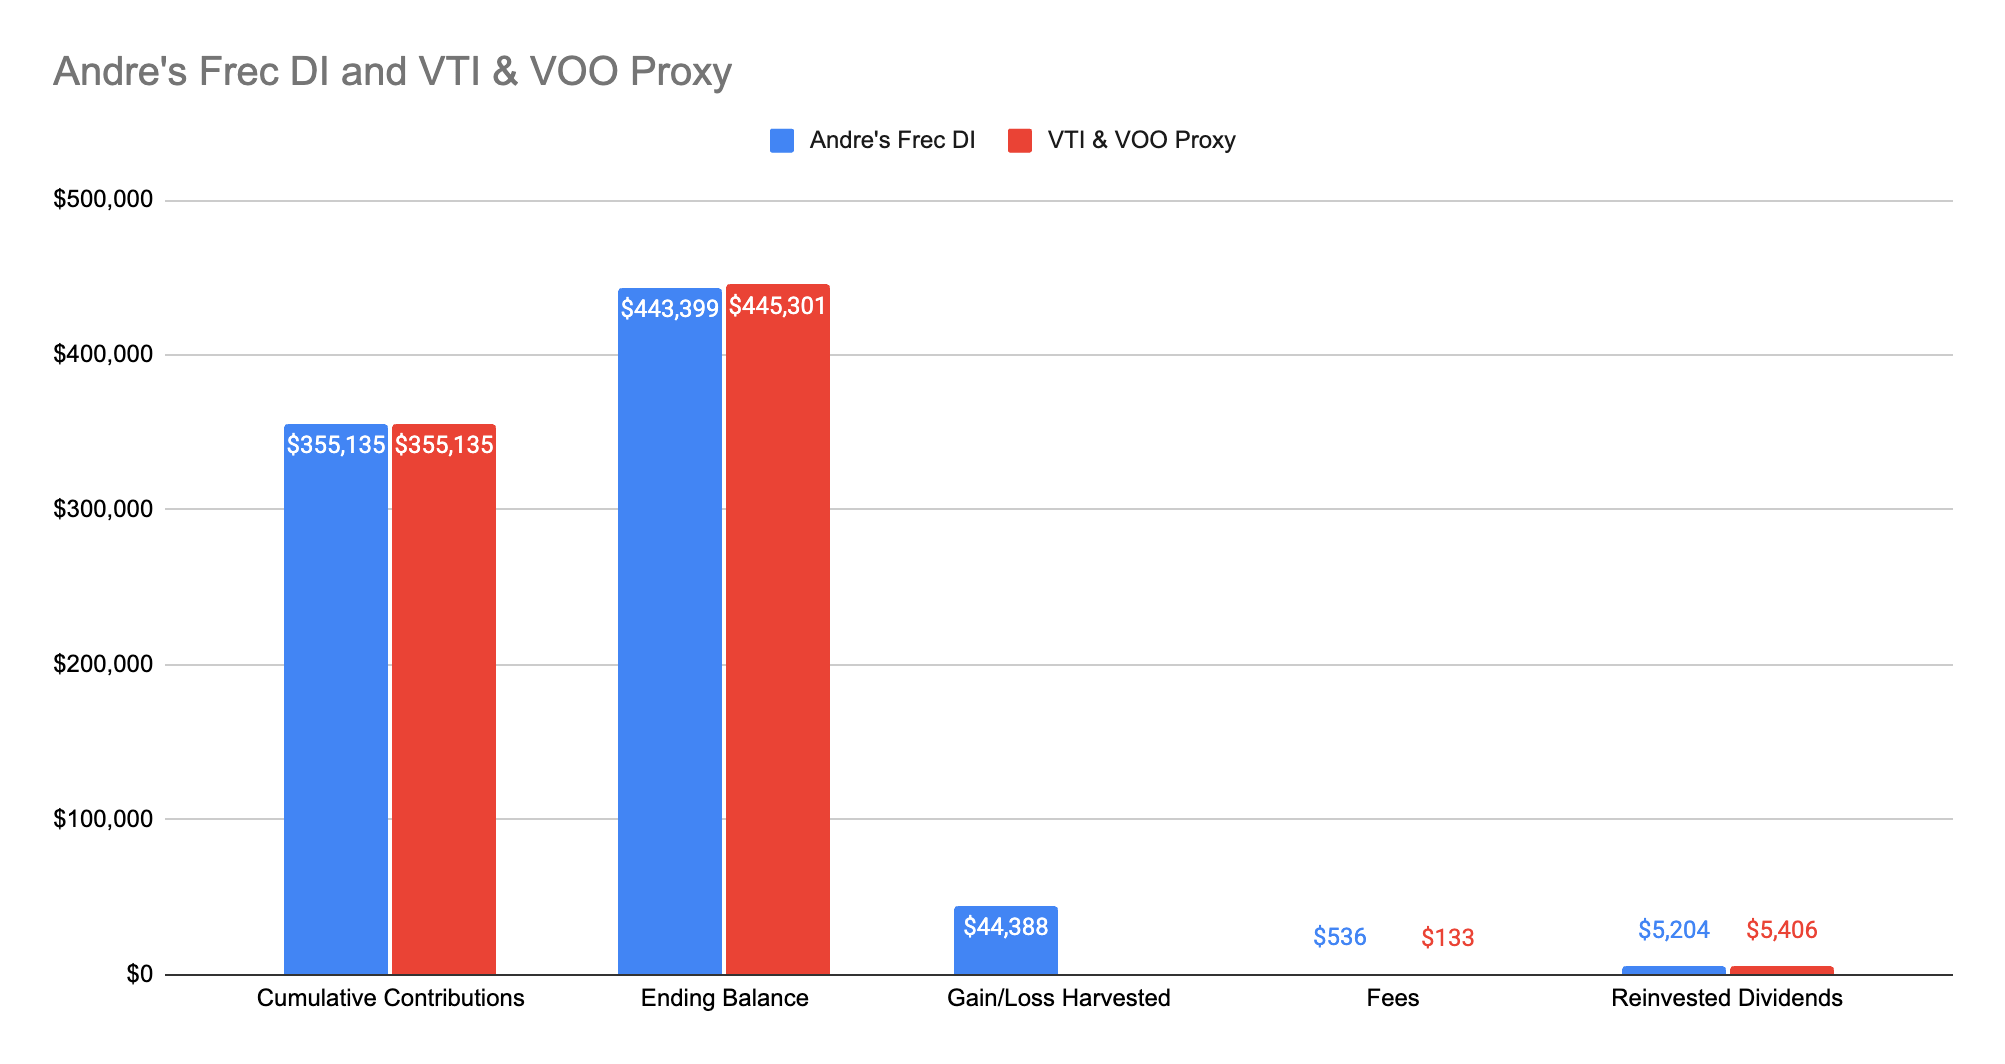
Performance results are hypothetical and generated using an AI-based simulation model. Please see footnote3 for important limitations regarding AI-generated simulations and historical data.
There is an extra layer here that I leaned on SilviaCFO’s AI to help compute, which is how much in losses I would have been able to manually harvest. Under the most optimistic scenario. Where you can operate like a machine harvesting losses anytime any of your lots were down 5%, it estimated an ETF only portfolio could have harvested ~$25k4.
Although in practice, most people wouldn’t have executed this properly. In fact… I have a “failed experiment” where I bought $100k in VTI at the exact same time as I started my direct index. It is a “failed” experiment, because I should have bought VOO and considered the experiment doomed… and promptly forgot about this purchase (it is a single tax lot of many within my VTI holdings, I didn’t just forget about $100k).
So what does holding this tax lot still tell us exactly? Well… it is hard given the tools available today to perfectly tax loss harvest manually. Particularly in a bull market. Even with the volatility we have seen these past years.
Frec’s quant team has also put out a very good research paper specifically comparing direct indexing to ETFs. Their historical simulations suggest that an S&P 500 direct indexing approach may harvest 1.9x to 2.1x more capital losses than a comparable ETF-based tax loss harvesting approach. You can read more about their methodology and assumptions in their full research paper here.
Takeaway: I think it is conservative to say that Frec was able to harvest 2x more losses5 than I would have done manually. So since they harvested a total of $44,388 in losses, nearly $22k of that is completely incremental to what I could have done with ETFs.
Alpha?
If we are able to calculate an incremental $22k in tax loss harvesting from direct indexing, we are closer to calculating the alpha that the strategy gave us over the alternative!
I used every single dollar of losses provided to sell off Uber shares which were long term capital gains. I am in California. So we are going to assume the following tax treatment:
Federal Long Term Capital Gains; 20%
NIIT: 3.8%
California: 9.3%
Which gives us…
… drum roll…
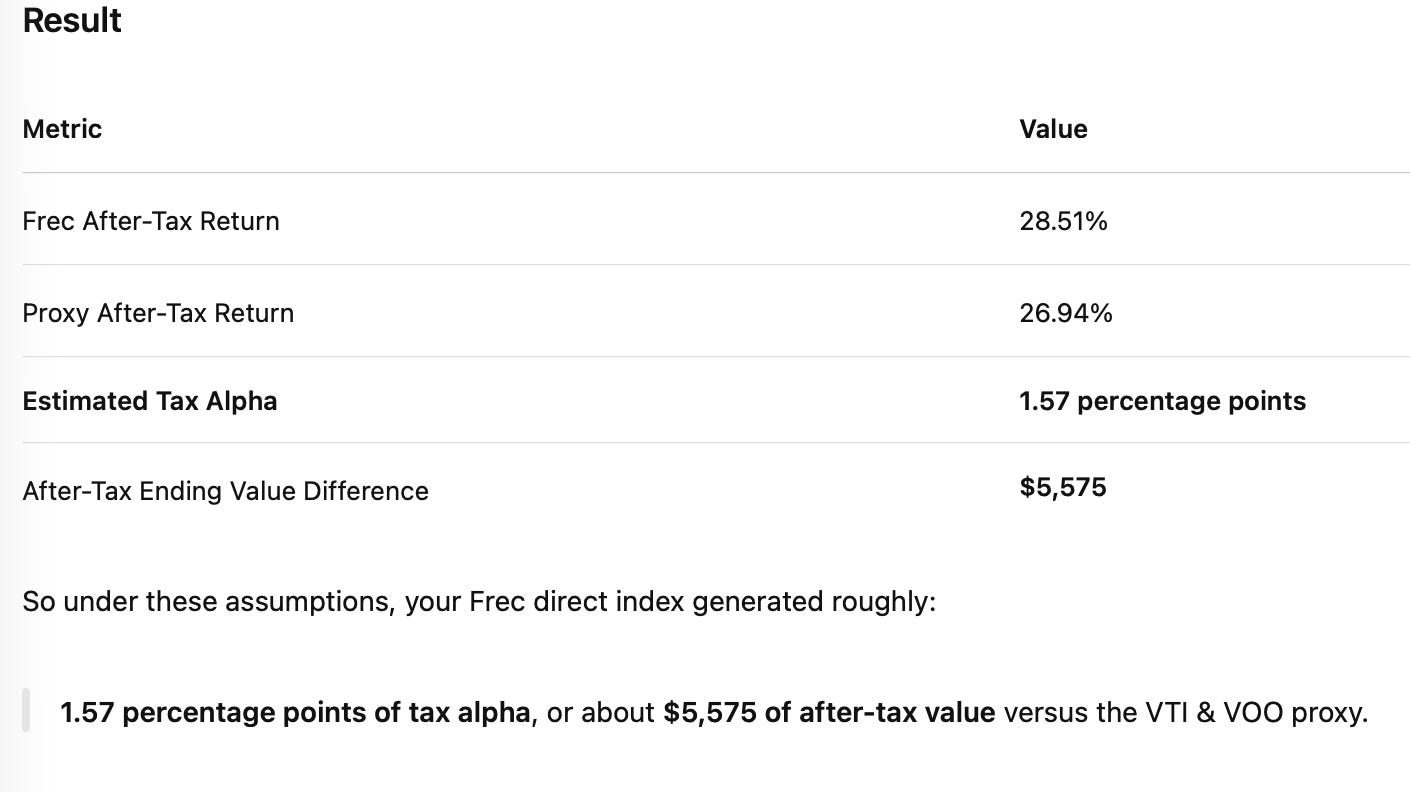
So my very personal tax alpha of 1.57%, or $5,575 of after-tax value.
Note: This is complicated to calculate. It is also going to be different for every single person. If you were in a higher tax bracket than me and were offsetting short term gains, your alpha could be even higher. I also simplified things and treated everything as if it occurred in 1 year for tax purposes.
An incremental $5,575 in after tax value is just the pure financial element too. Having these losses helped me more quickly diversify out of my concentrated position. This led me to liquidating even more Uber near their all-time highs of nearly $100 before they came back to earth in the $70s. None of that is factored in here.
What Exactly Does My Direct Index Hold?
The target index I selected with Frec is the CRSP US Total Market Index which comprises roughly 3,460 total stock tickers!
I originally thought I would own all 3,449 companies, but it turns out that my direct index currently holds 795 positions. Over my entire history using Frec, I have held 1,735 unique tickers.
The actual holdings don’t matter to me, but what does matter is Frec continuing to avoid “drift”, as mentioned earlier has generally stayed within Frec’s target of “above or below the index by a maximum of 0.77% per year”.6
Since the US market is so top heavy, I thought it would be interesting to see how my top ten holdings are stacking up to the overall US market. Especially since looking at the top ten list above, I noticed my former employer, Meta noticeably on the second page with Micron taking its place.
Top Ten Holdings
Looking at VTI’s reported holdings as a proxy, the top 10 positions represent ~32% of the total index’s weight, which is exactly the same as my Frec direct index.
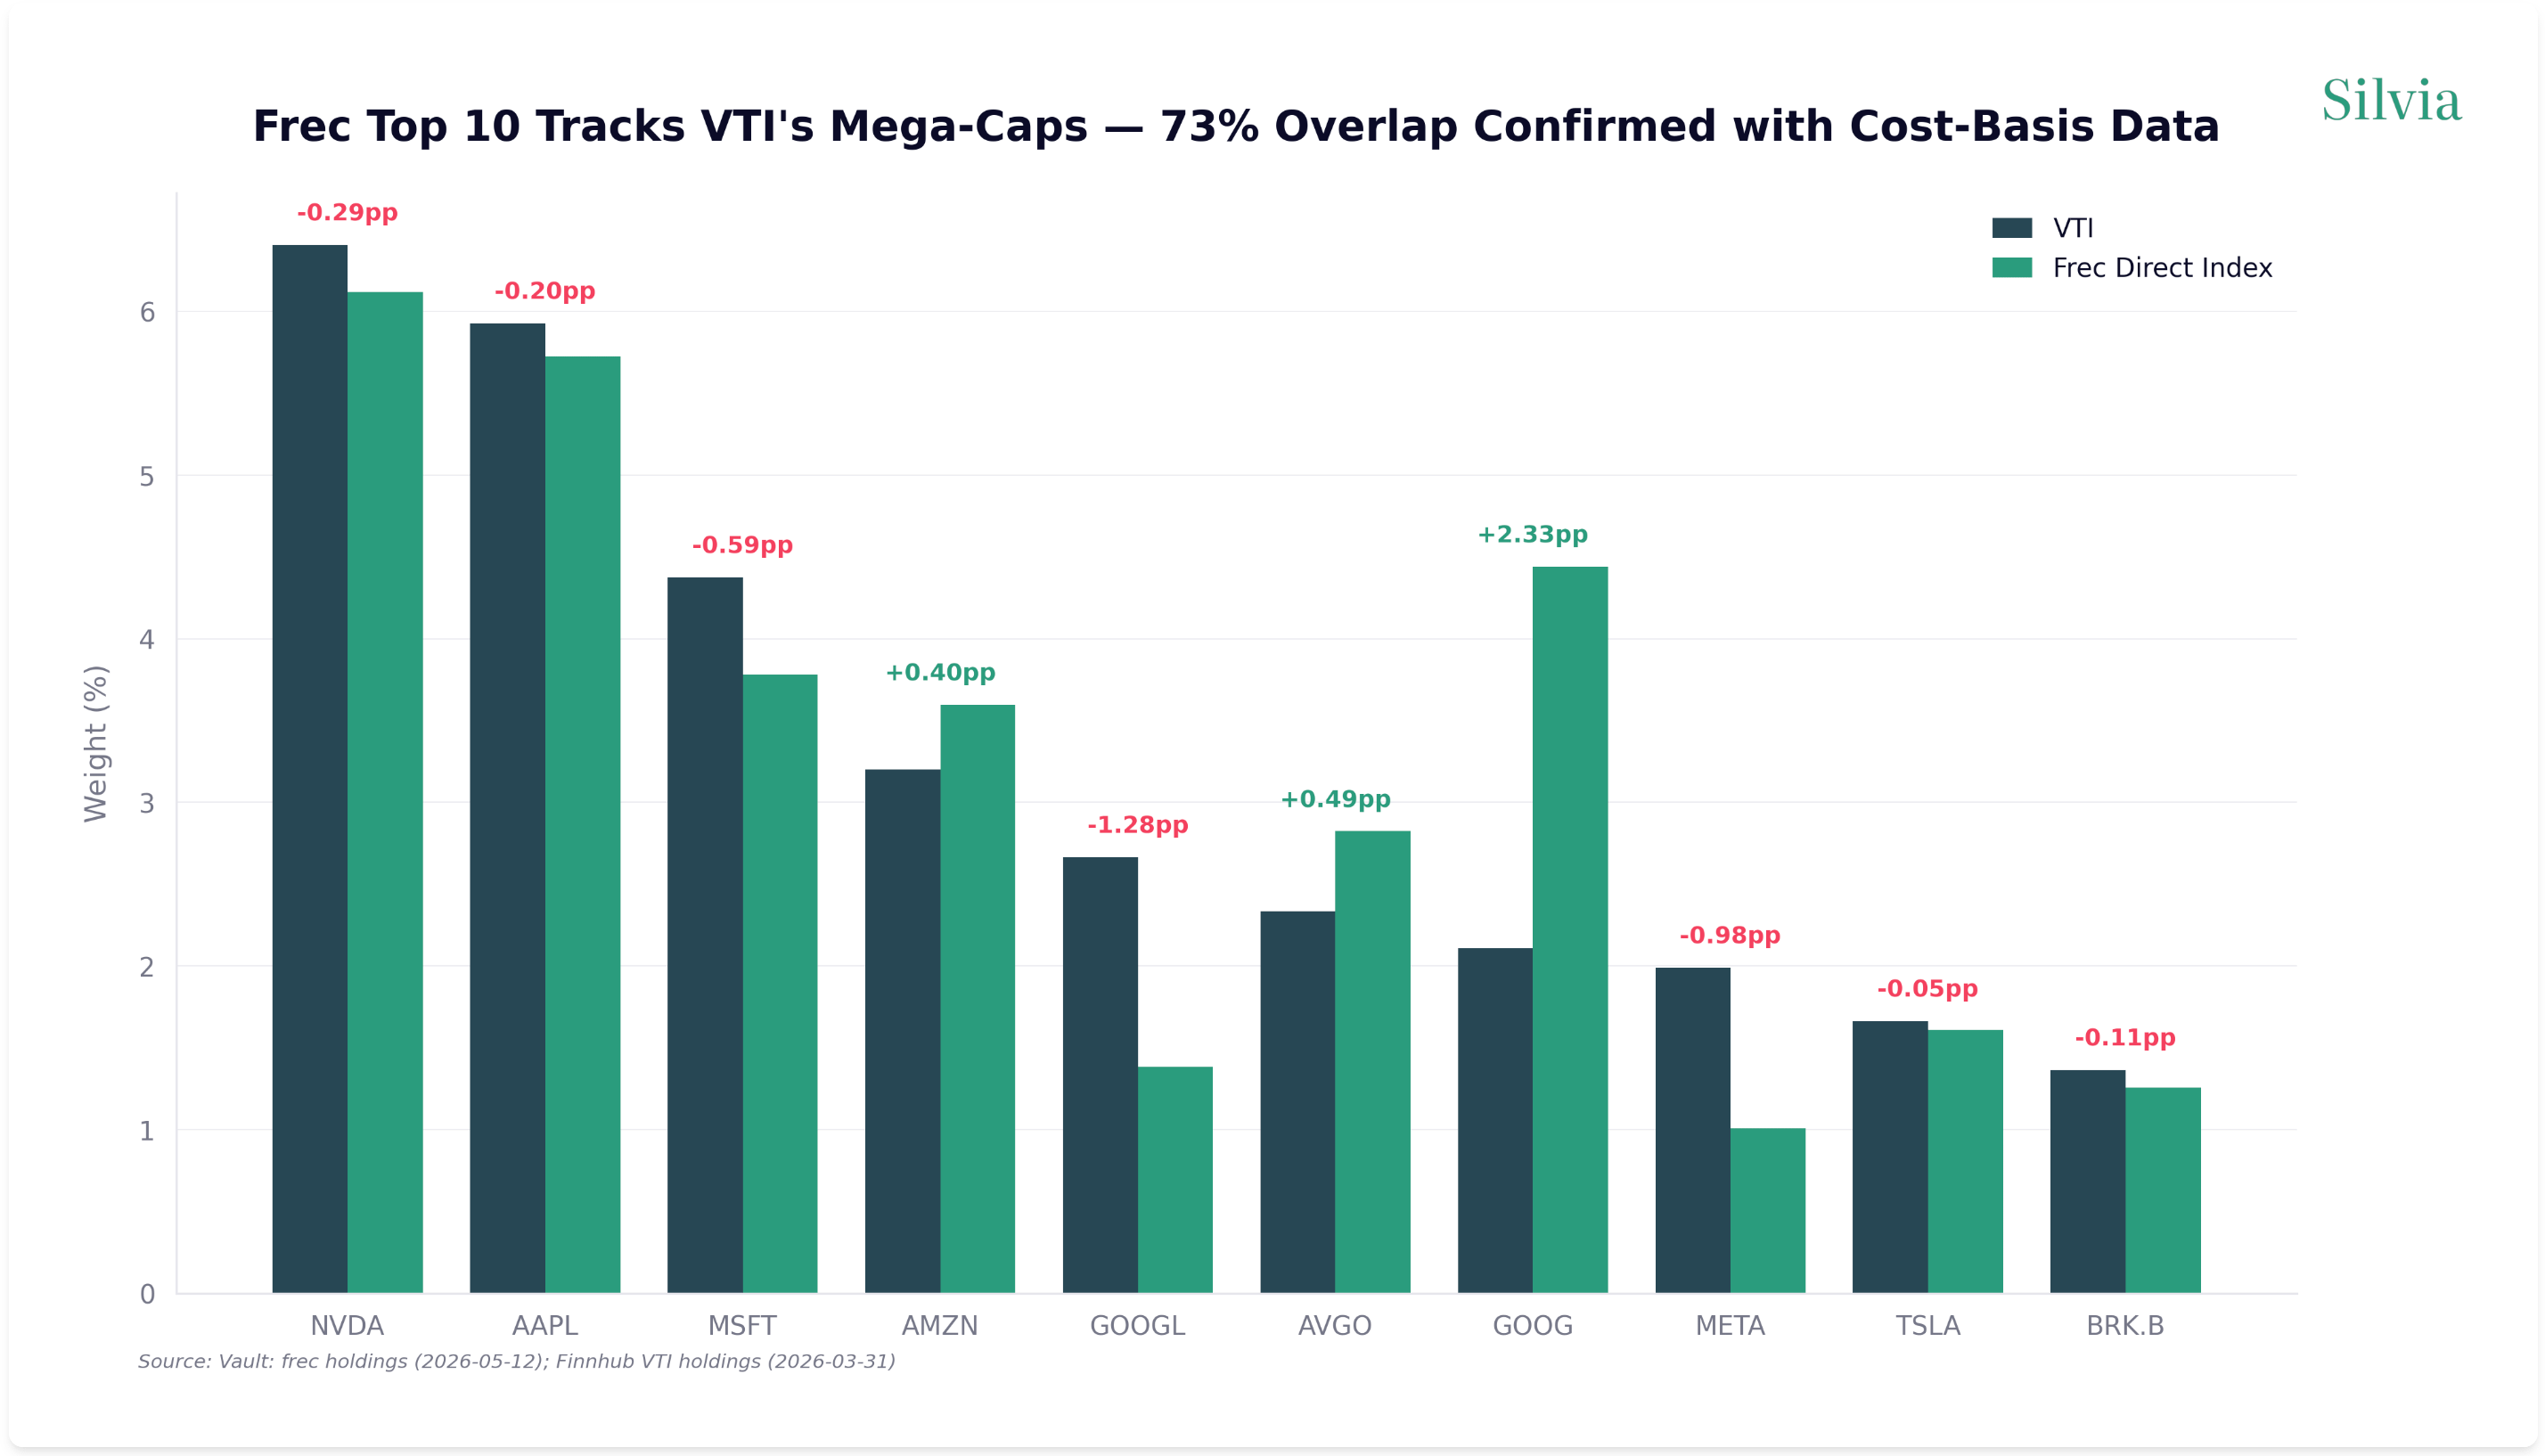
Google appears to be overweight in Frec, but when you combine GOOG and GOOGL they represent the actual delta is closer to 1% representing ~5.82% Frec vs 4.77% in VTI (which is also lagging with Vanguard’s latest data only through 3/31/2026).
My Frec index is also nearly 1% lighter on META relative to VTI. This is reflective of META’s recent drop after earnings which saw my direct index do its job by harvesting the losses and reinvesting in correlated assets.
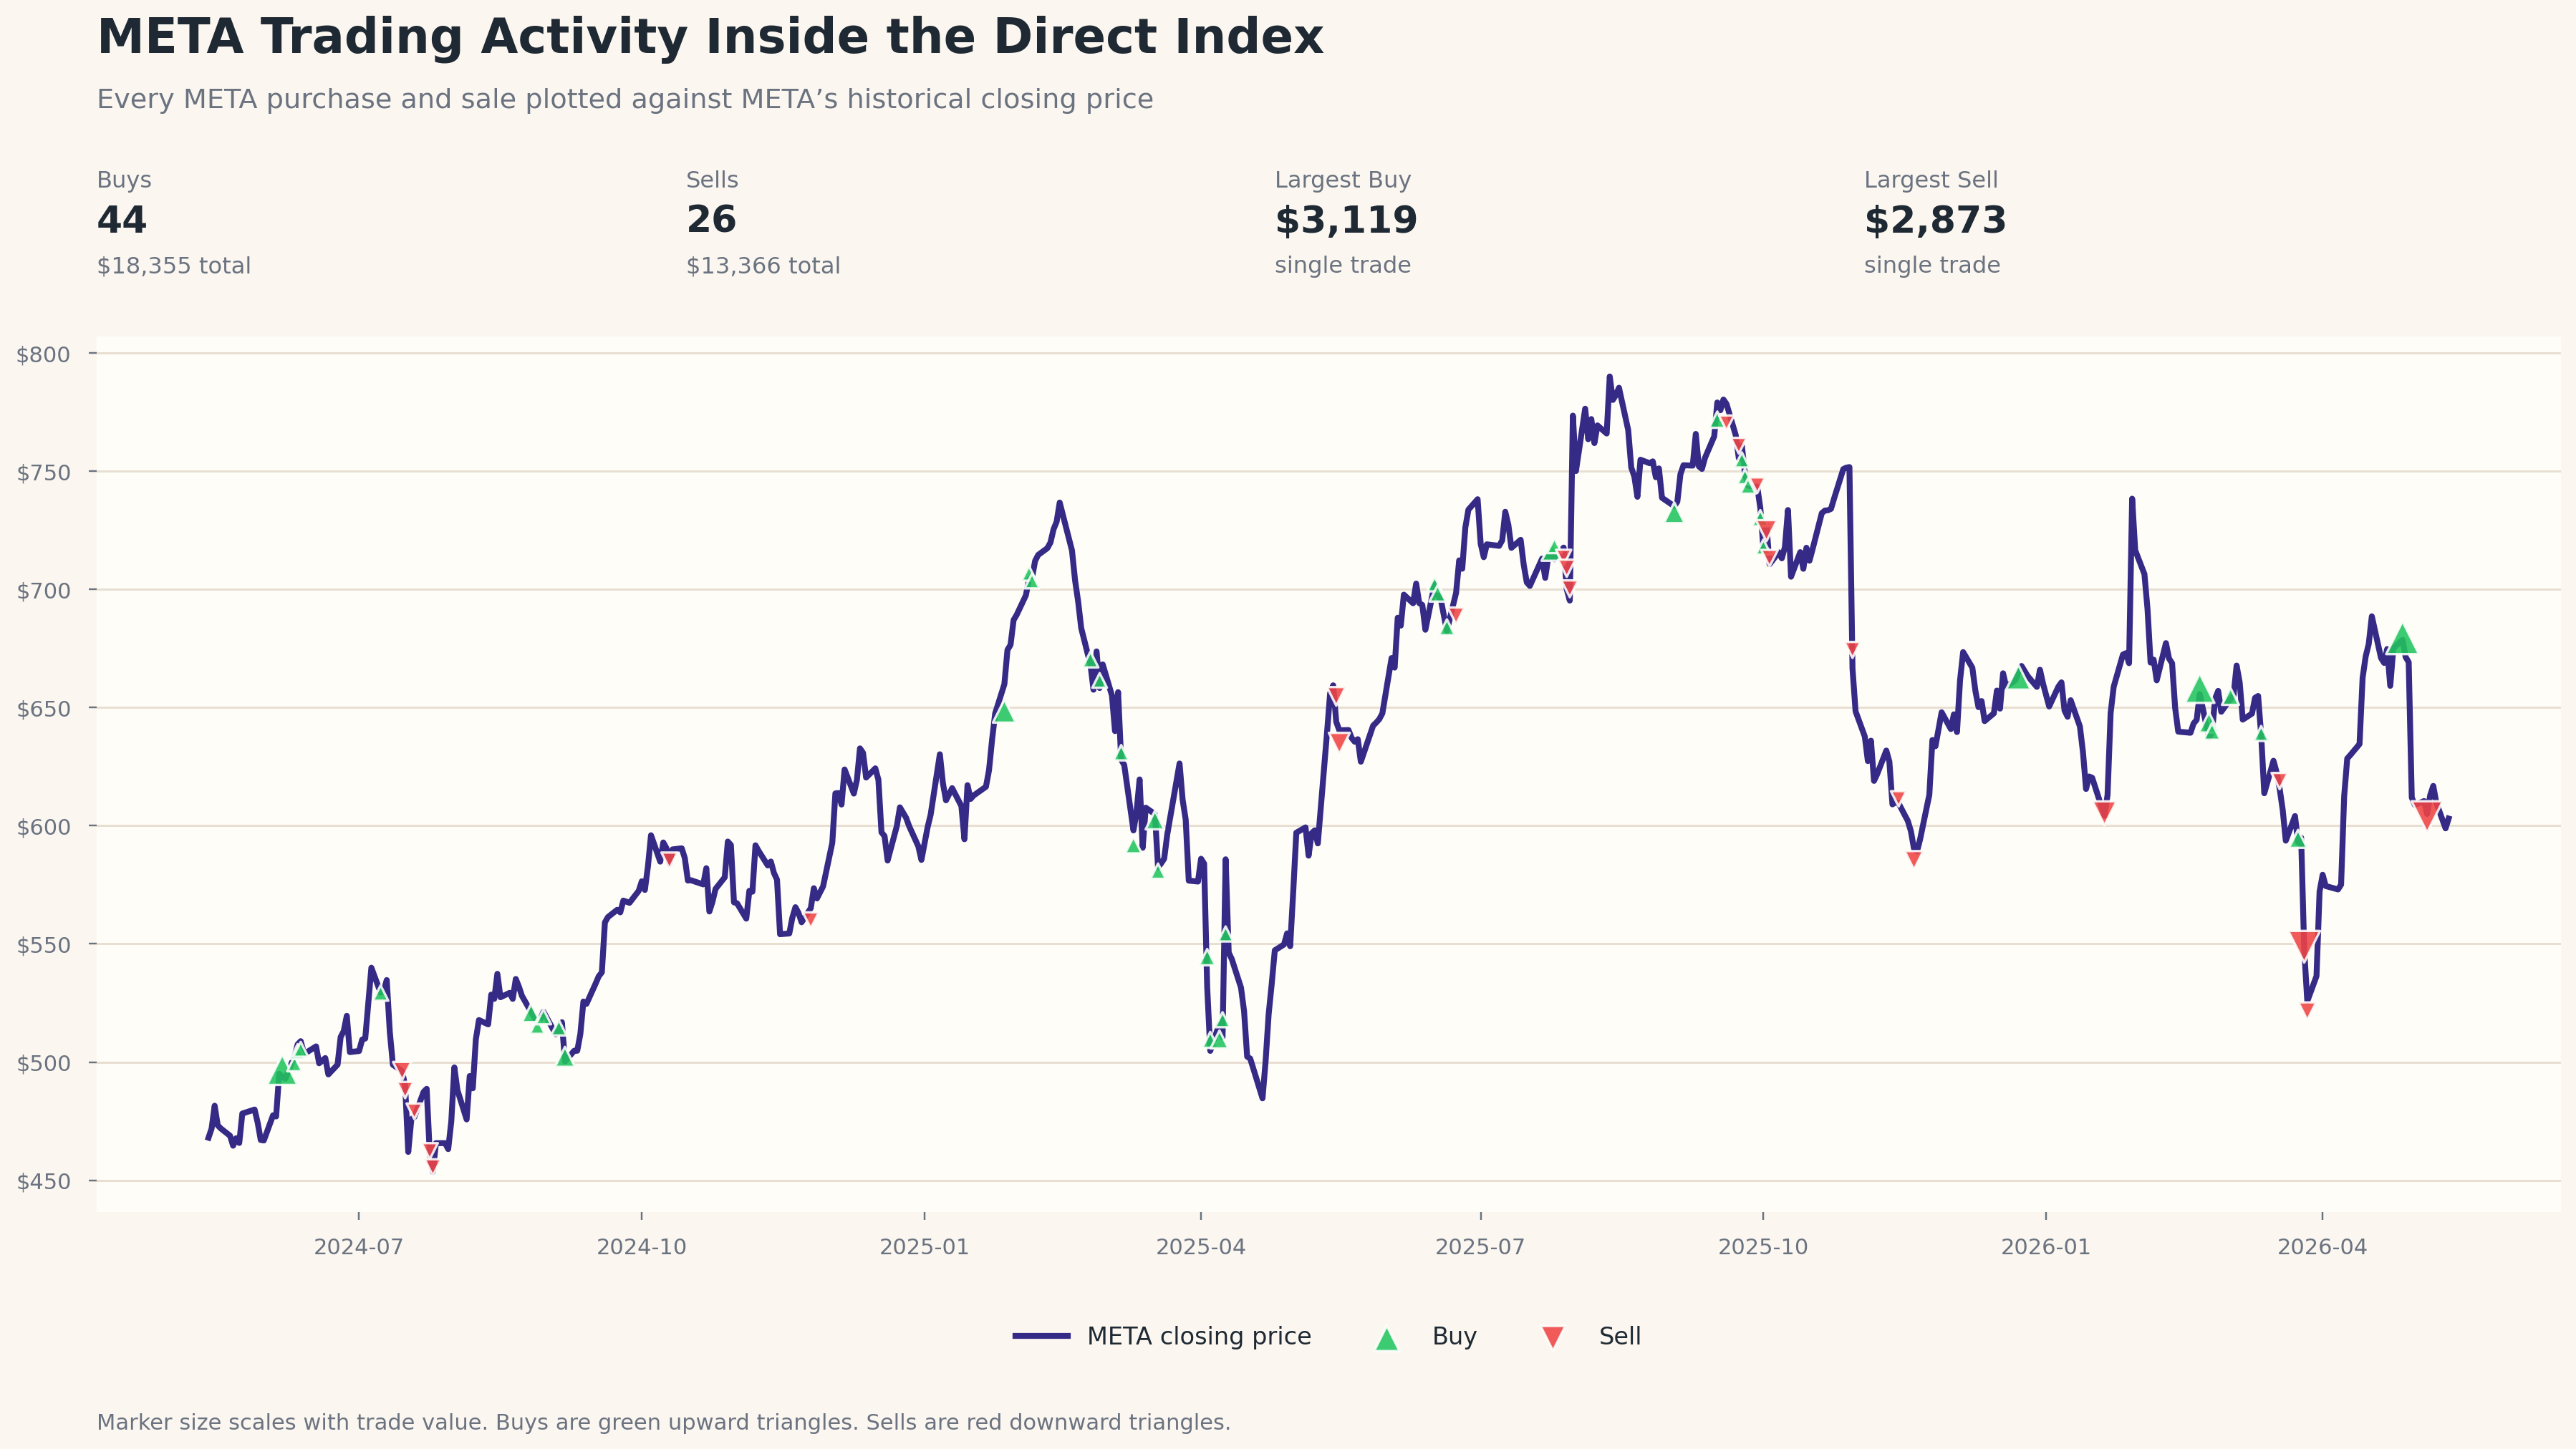
Zooming Into Meta
Since Meta is currently the most underrepresented, let’s look deeper at how Frec’s algorithms managed with Meta’s fluctuations. Across all purchases, sales, and dividends, there were 78 total META transactions in the direct index.
What about NVDA?
The above graph had me curious about NVDA. My index was very active playing catch up early on. I ran into an edge case where I contributed to my original direct index just prior to a stock split. I am guessing there was a hard coded exclusion for a short time period that I fell into. Although it was able to make up for lost ground with over 50 buys.
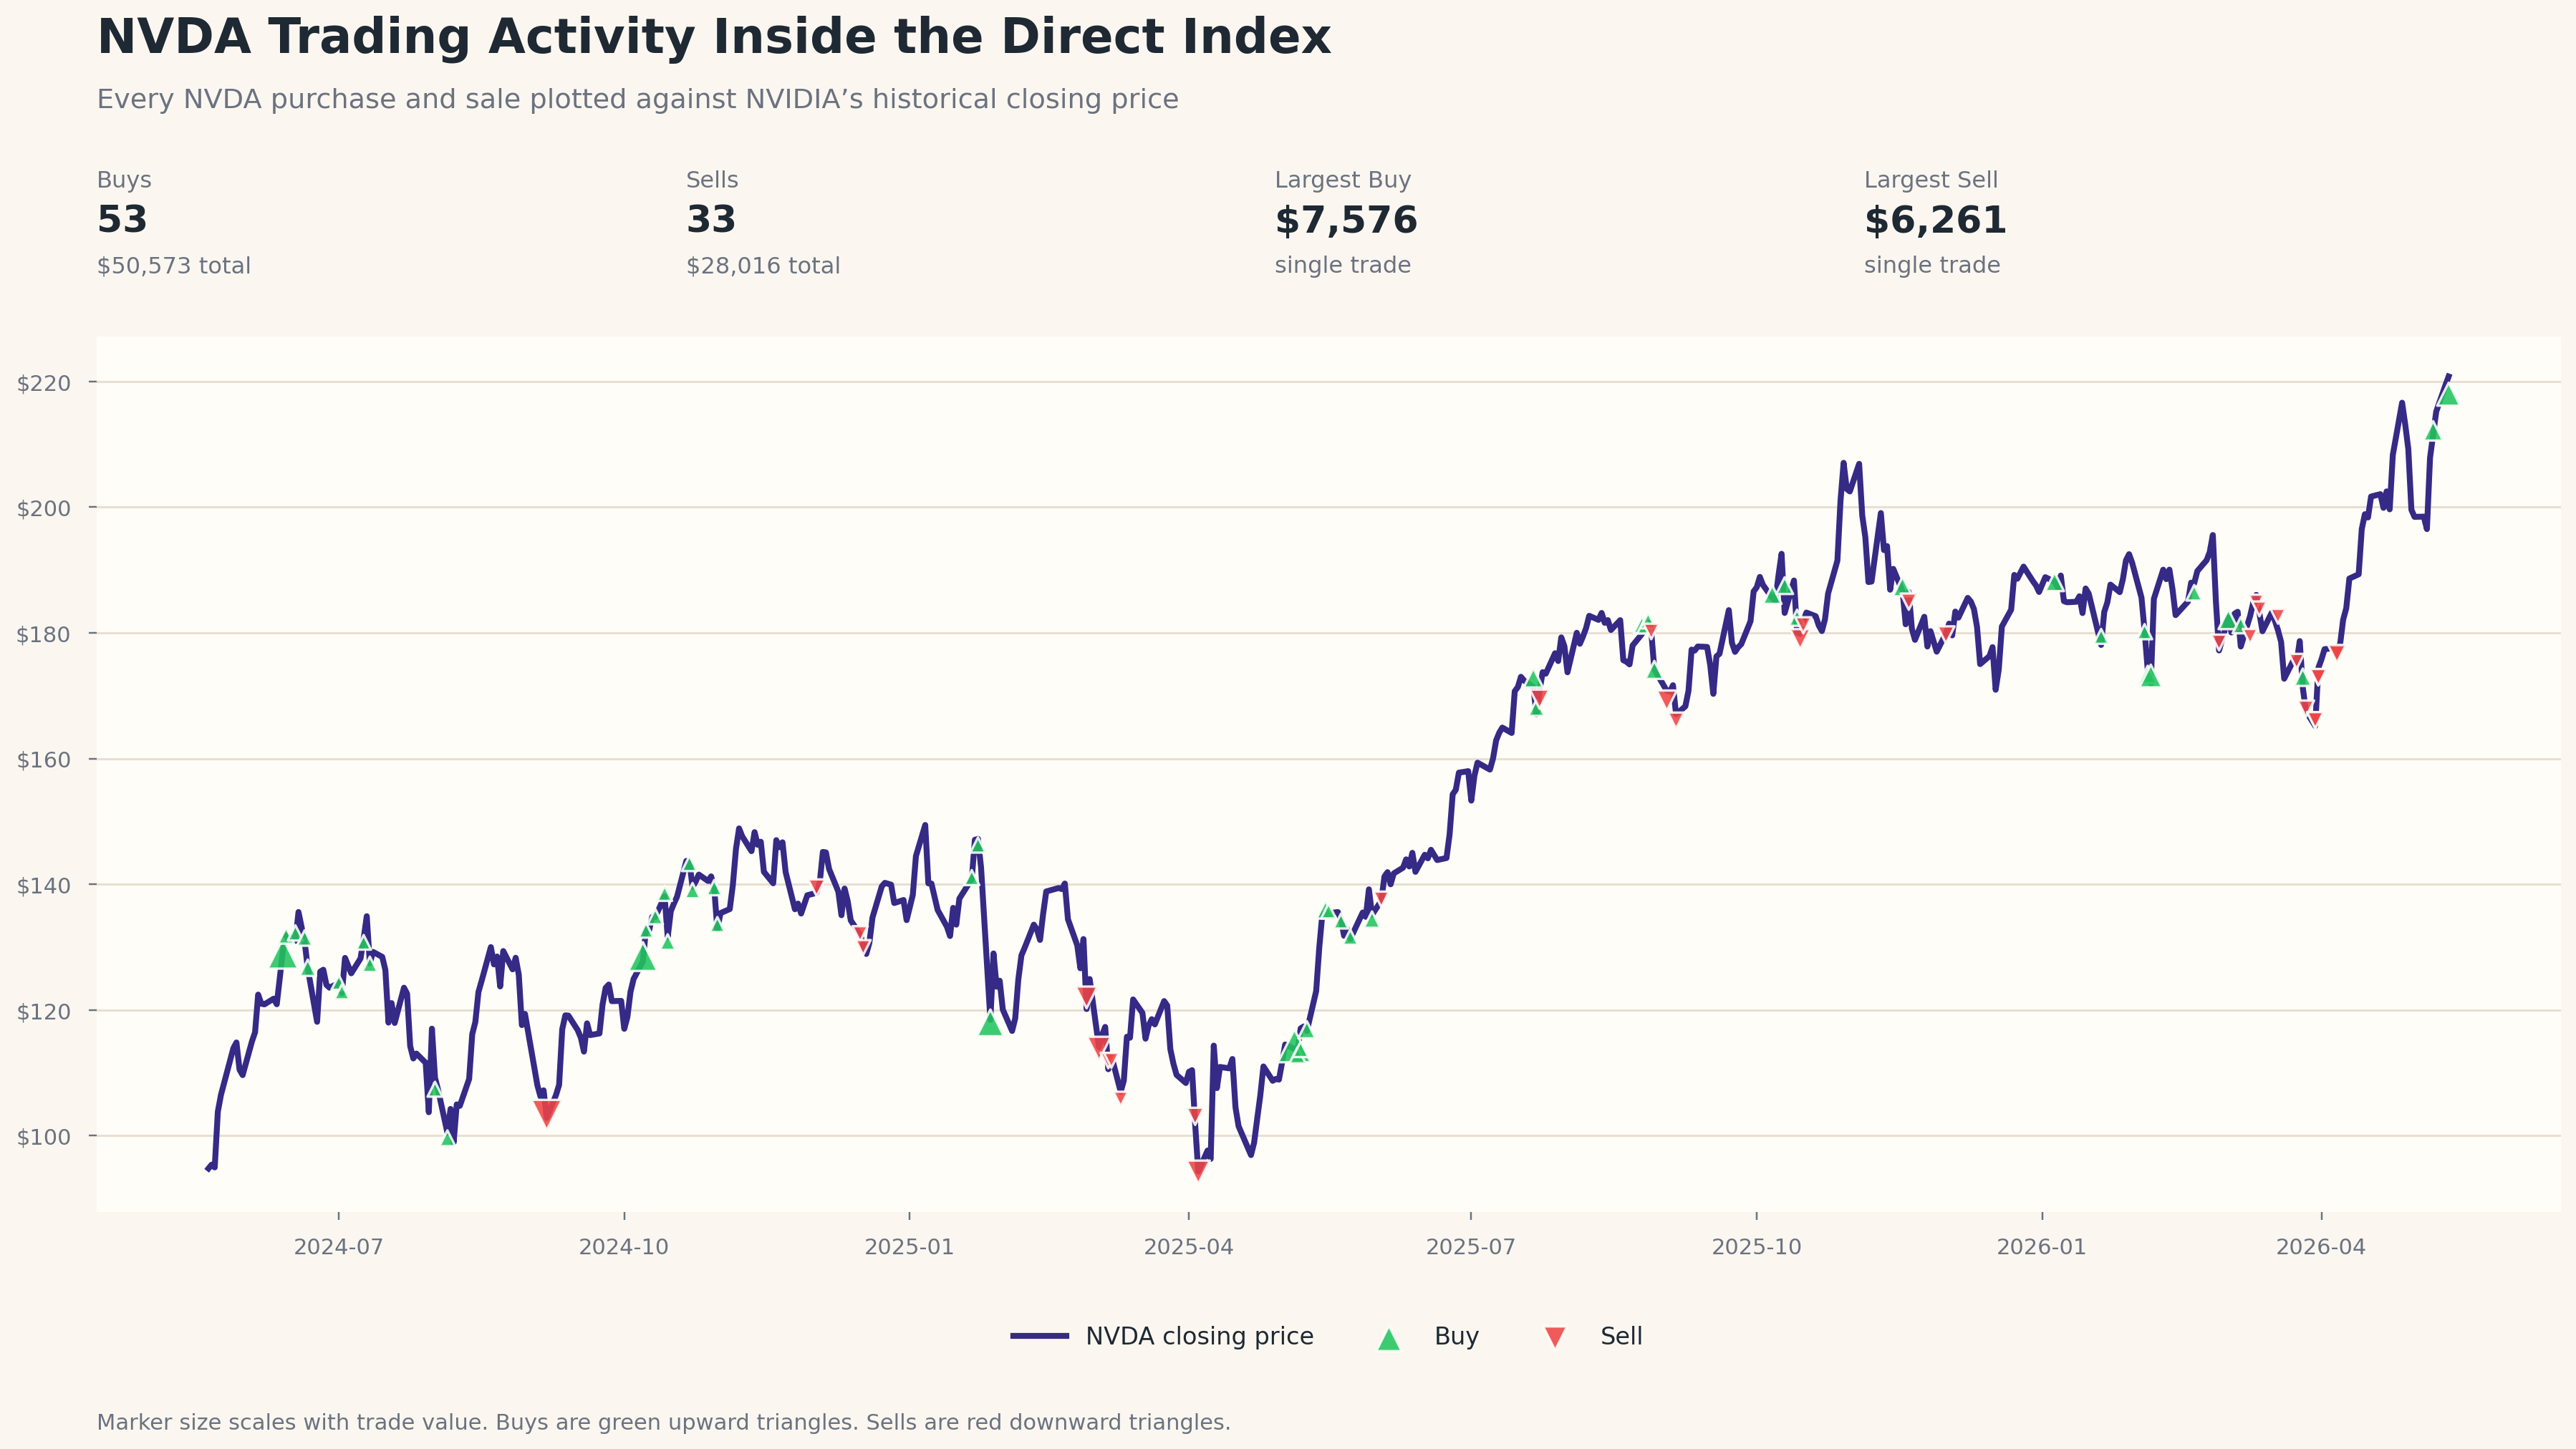
Here is that same chart with my deposits overlaid.
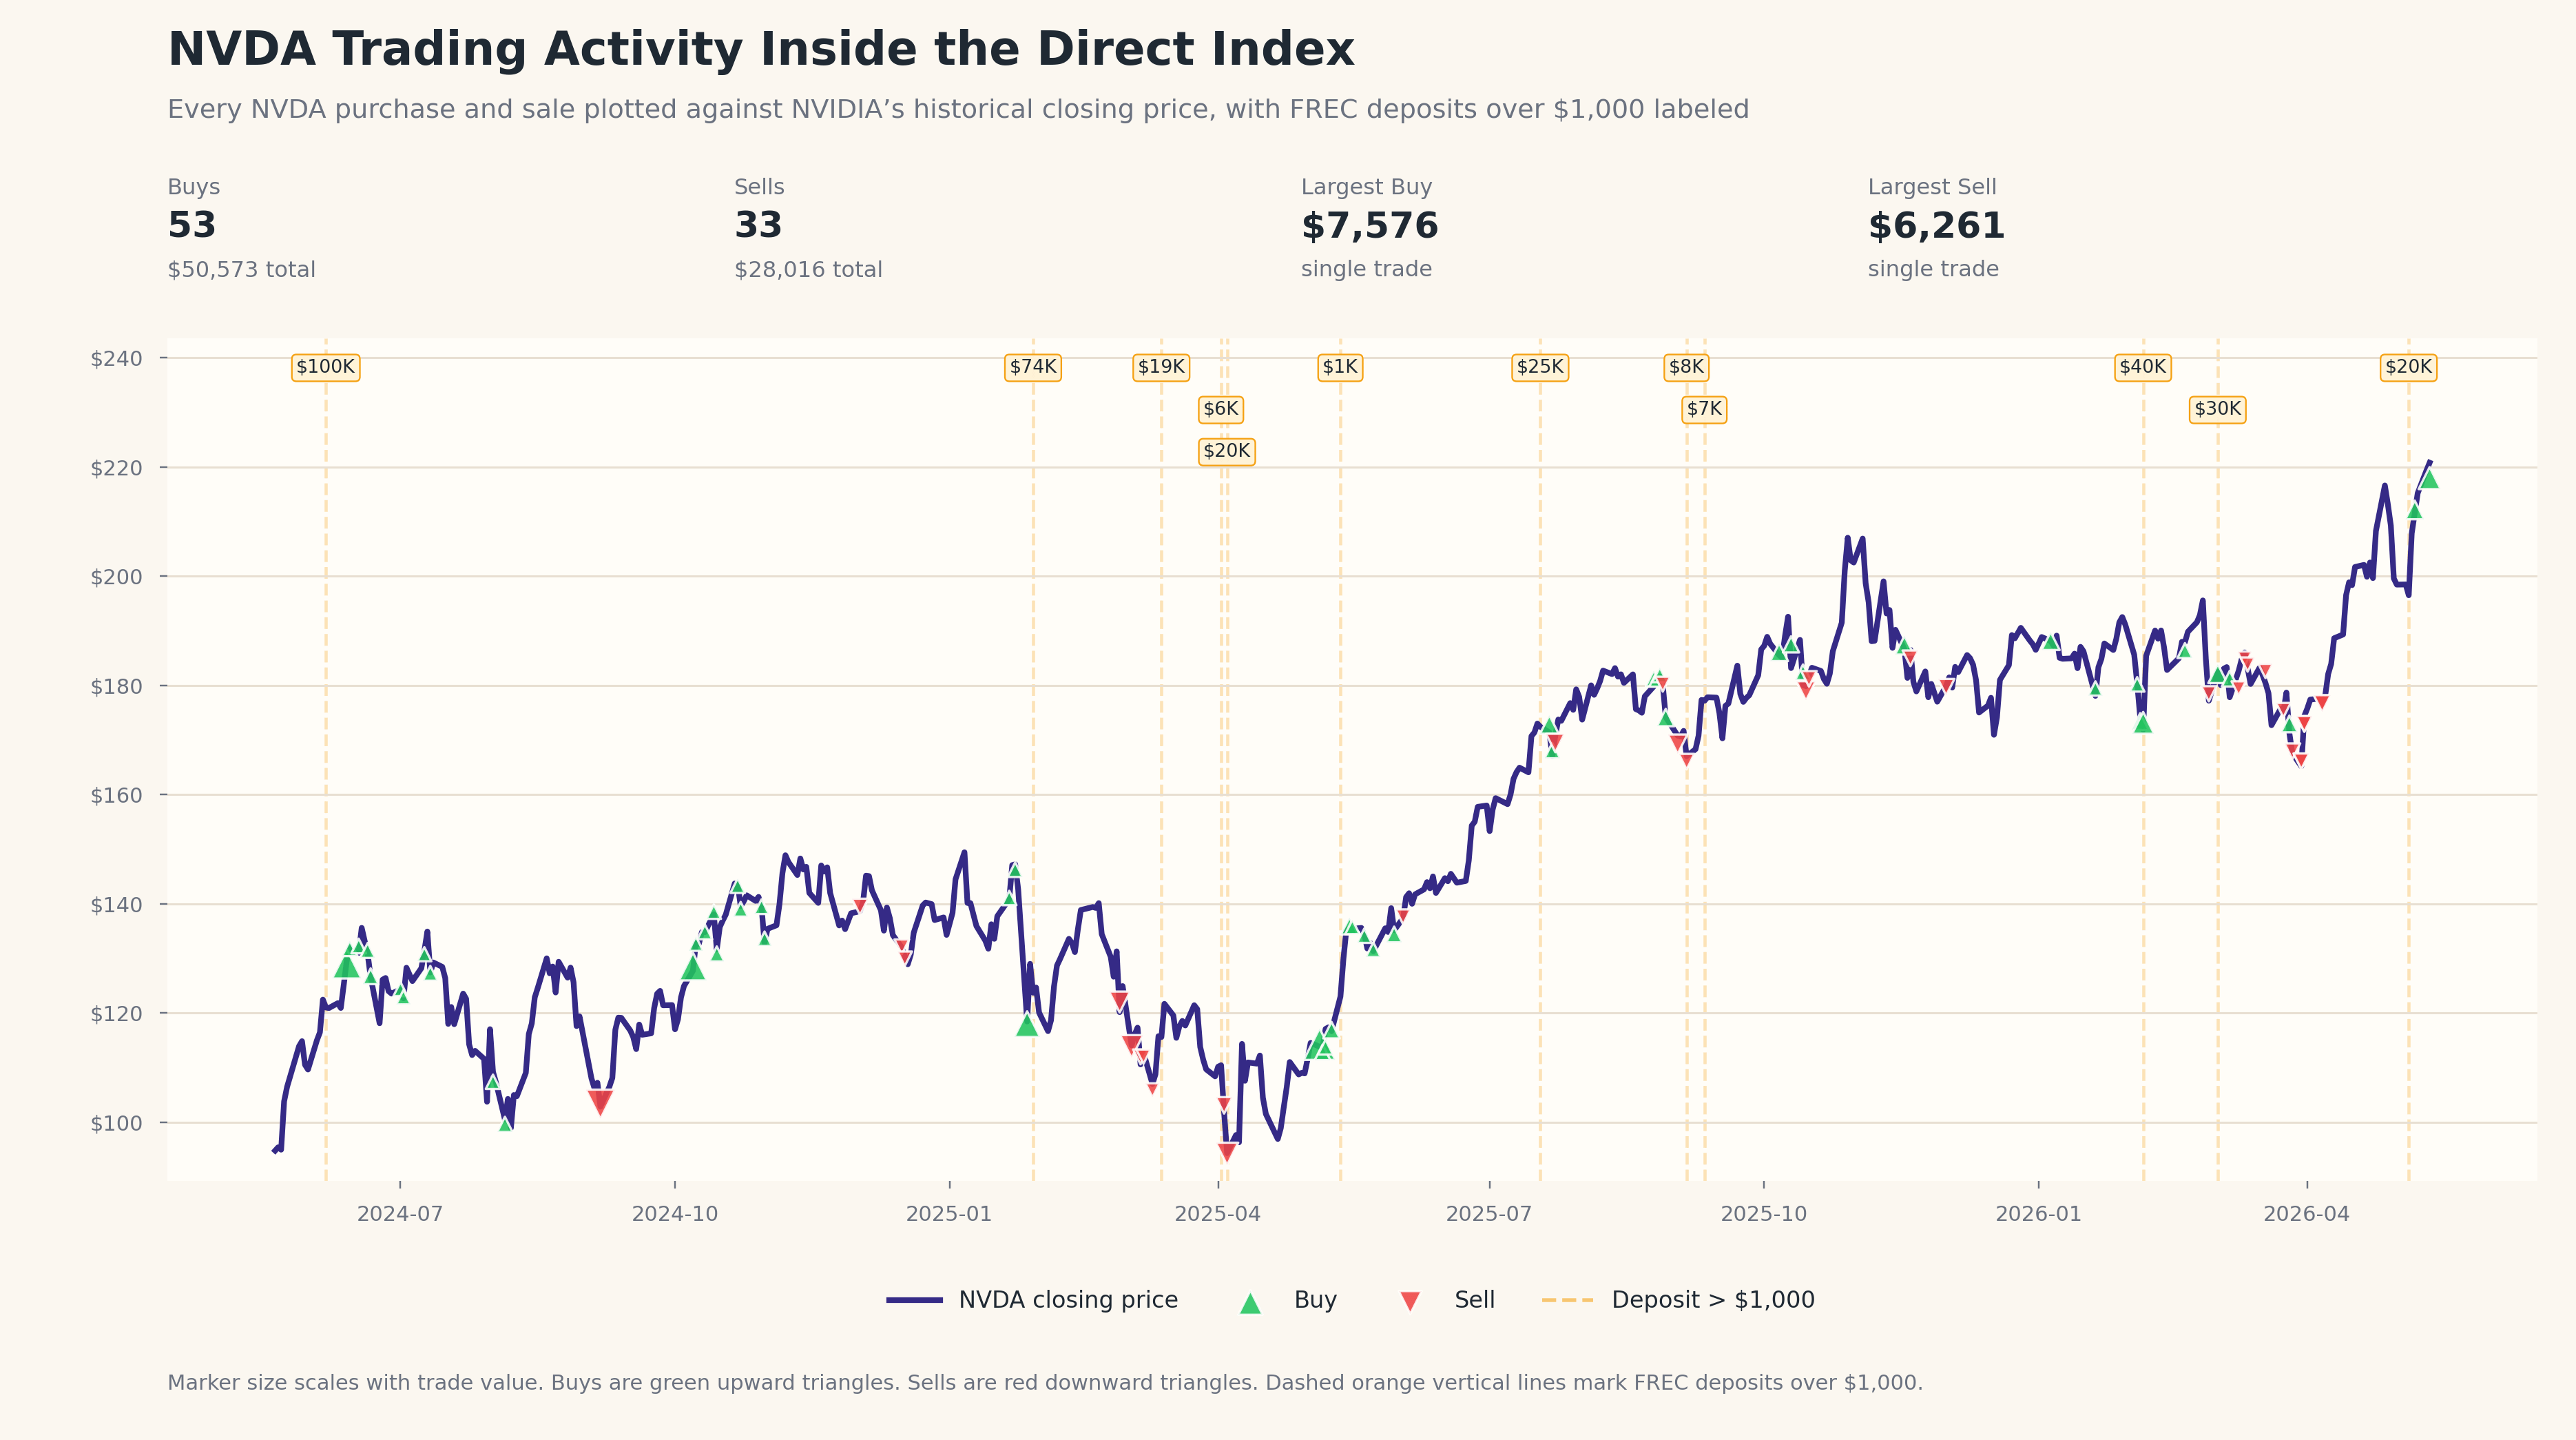
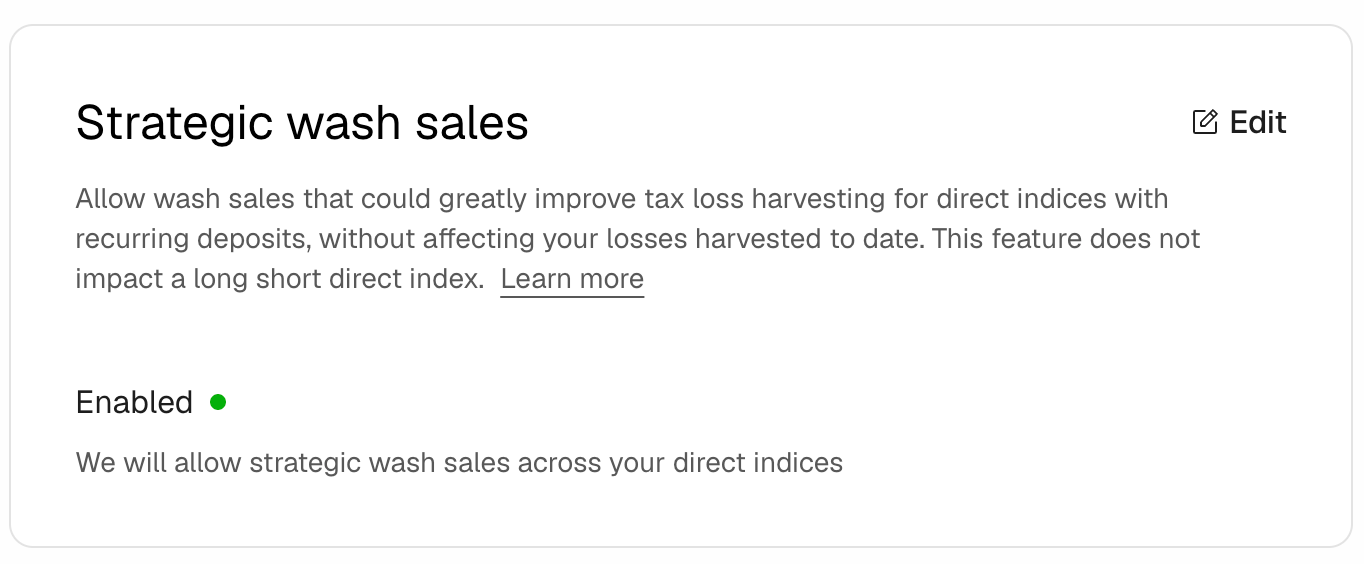
This helps explain more of the “why did it buy then?” questions I had. Additionally you might notice an increase in buying and selling behavior starting in mid-2025. I believe this lines up to when I enabled “Strategic Wash Sales” within Frec.
“This feature enables customers to make frequent deposits without negatively impacting tracking error and while providing opportunity to increase average tax loss harvesting opportunities by up to 15.5% for weekly deposits and up to 13.7% for monthly small to medium-sized deposits when investing in the S&P 500.”7
Here is my attempt to visualize some of those wash sales.
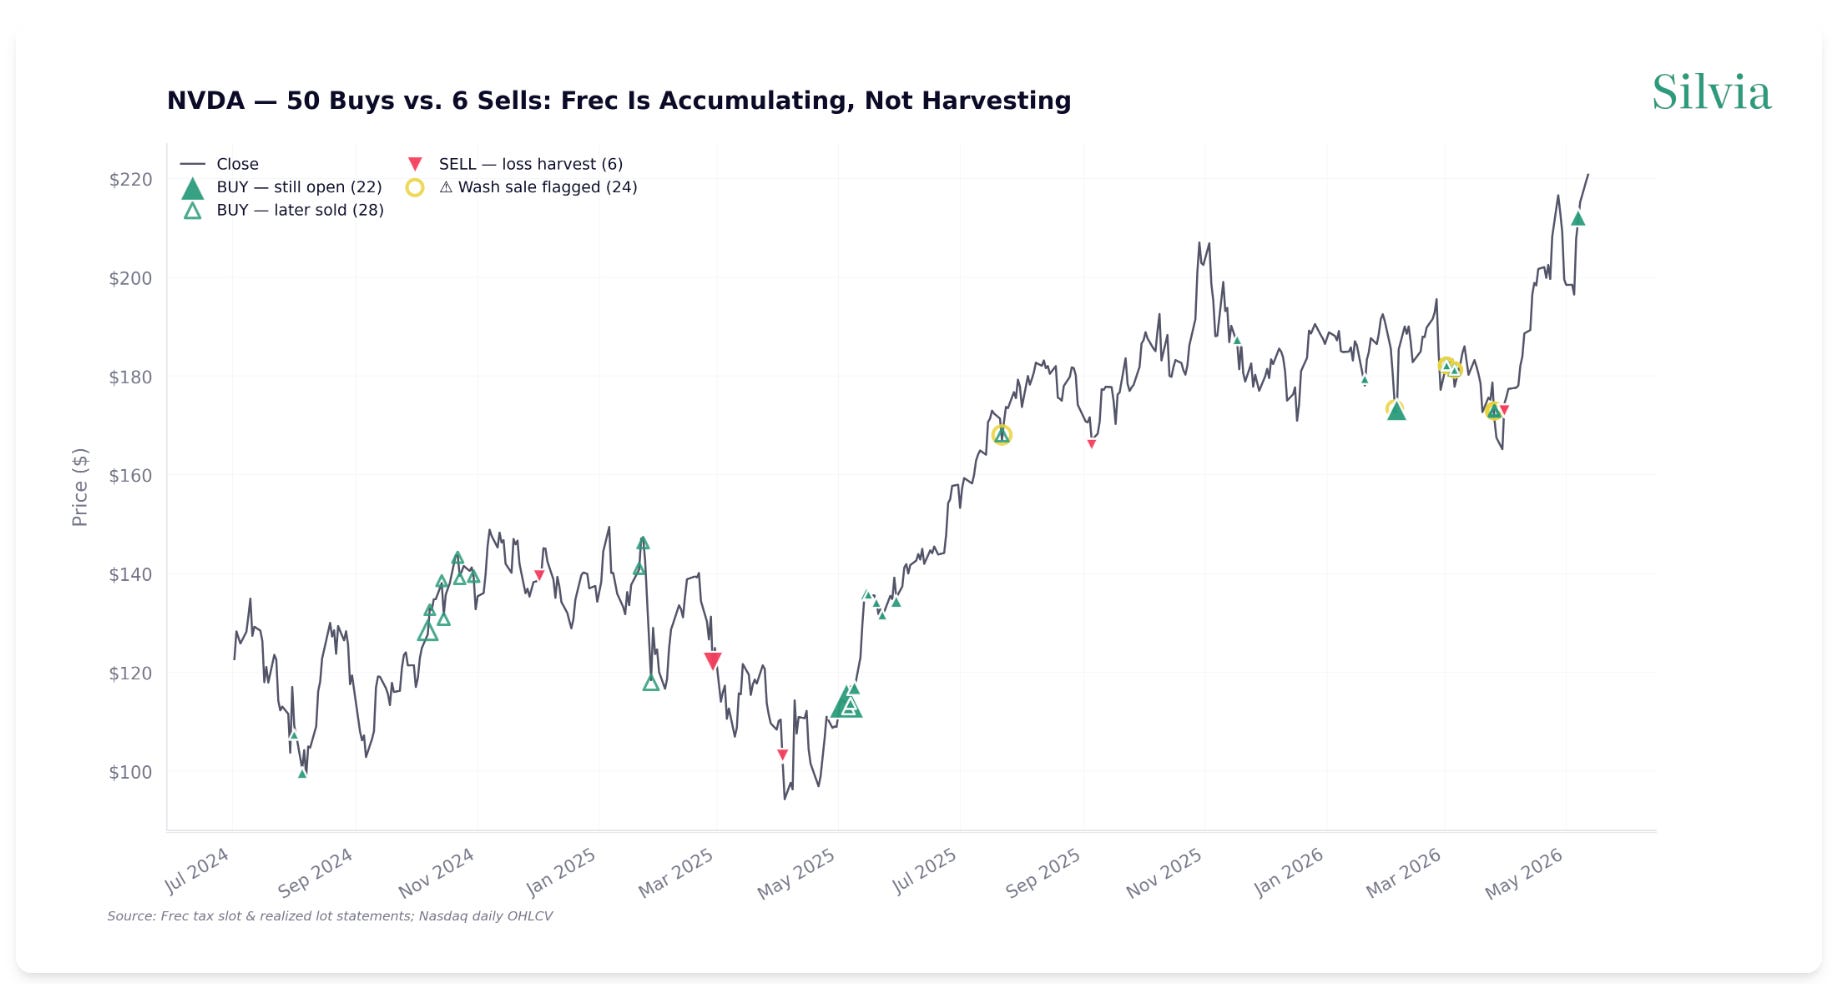
It has been fascinating to see how Frec’s algorithms have managed to keep the overall portfolio from drifting away from its benchmark, particularly as it regularly harvests losses from these extremely large positions.
My Approach To Contributions
Starting in 2025 I began to treat my direct index simply as part of my U.S. equities allocation. Any time I needed U.S. equities I would add new funds into my Frec direct index.
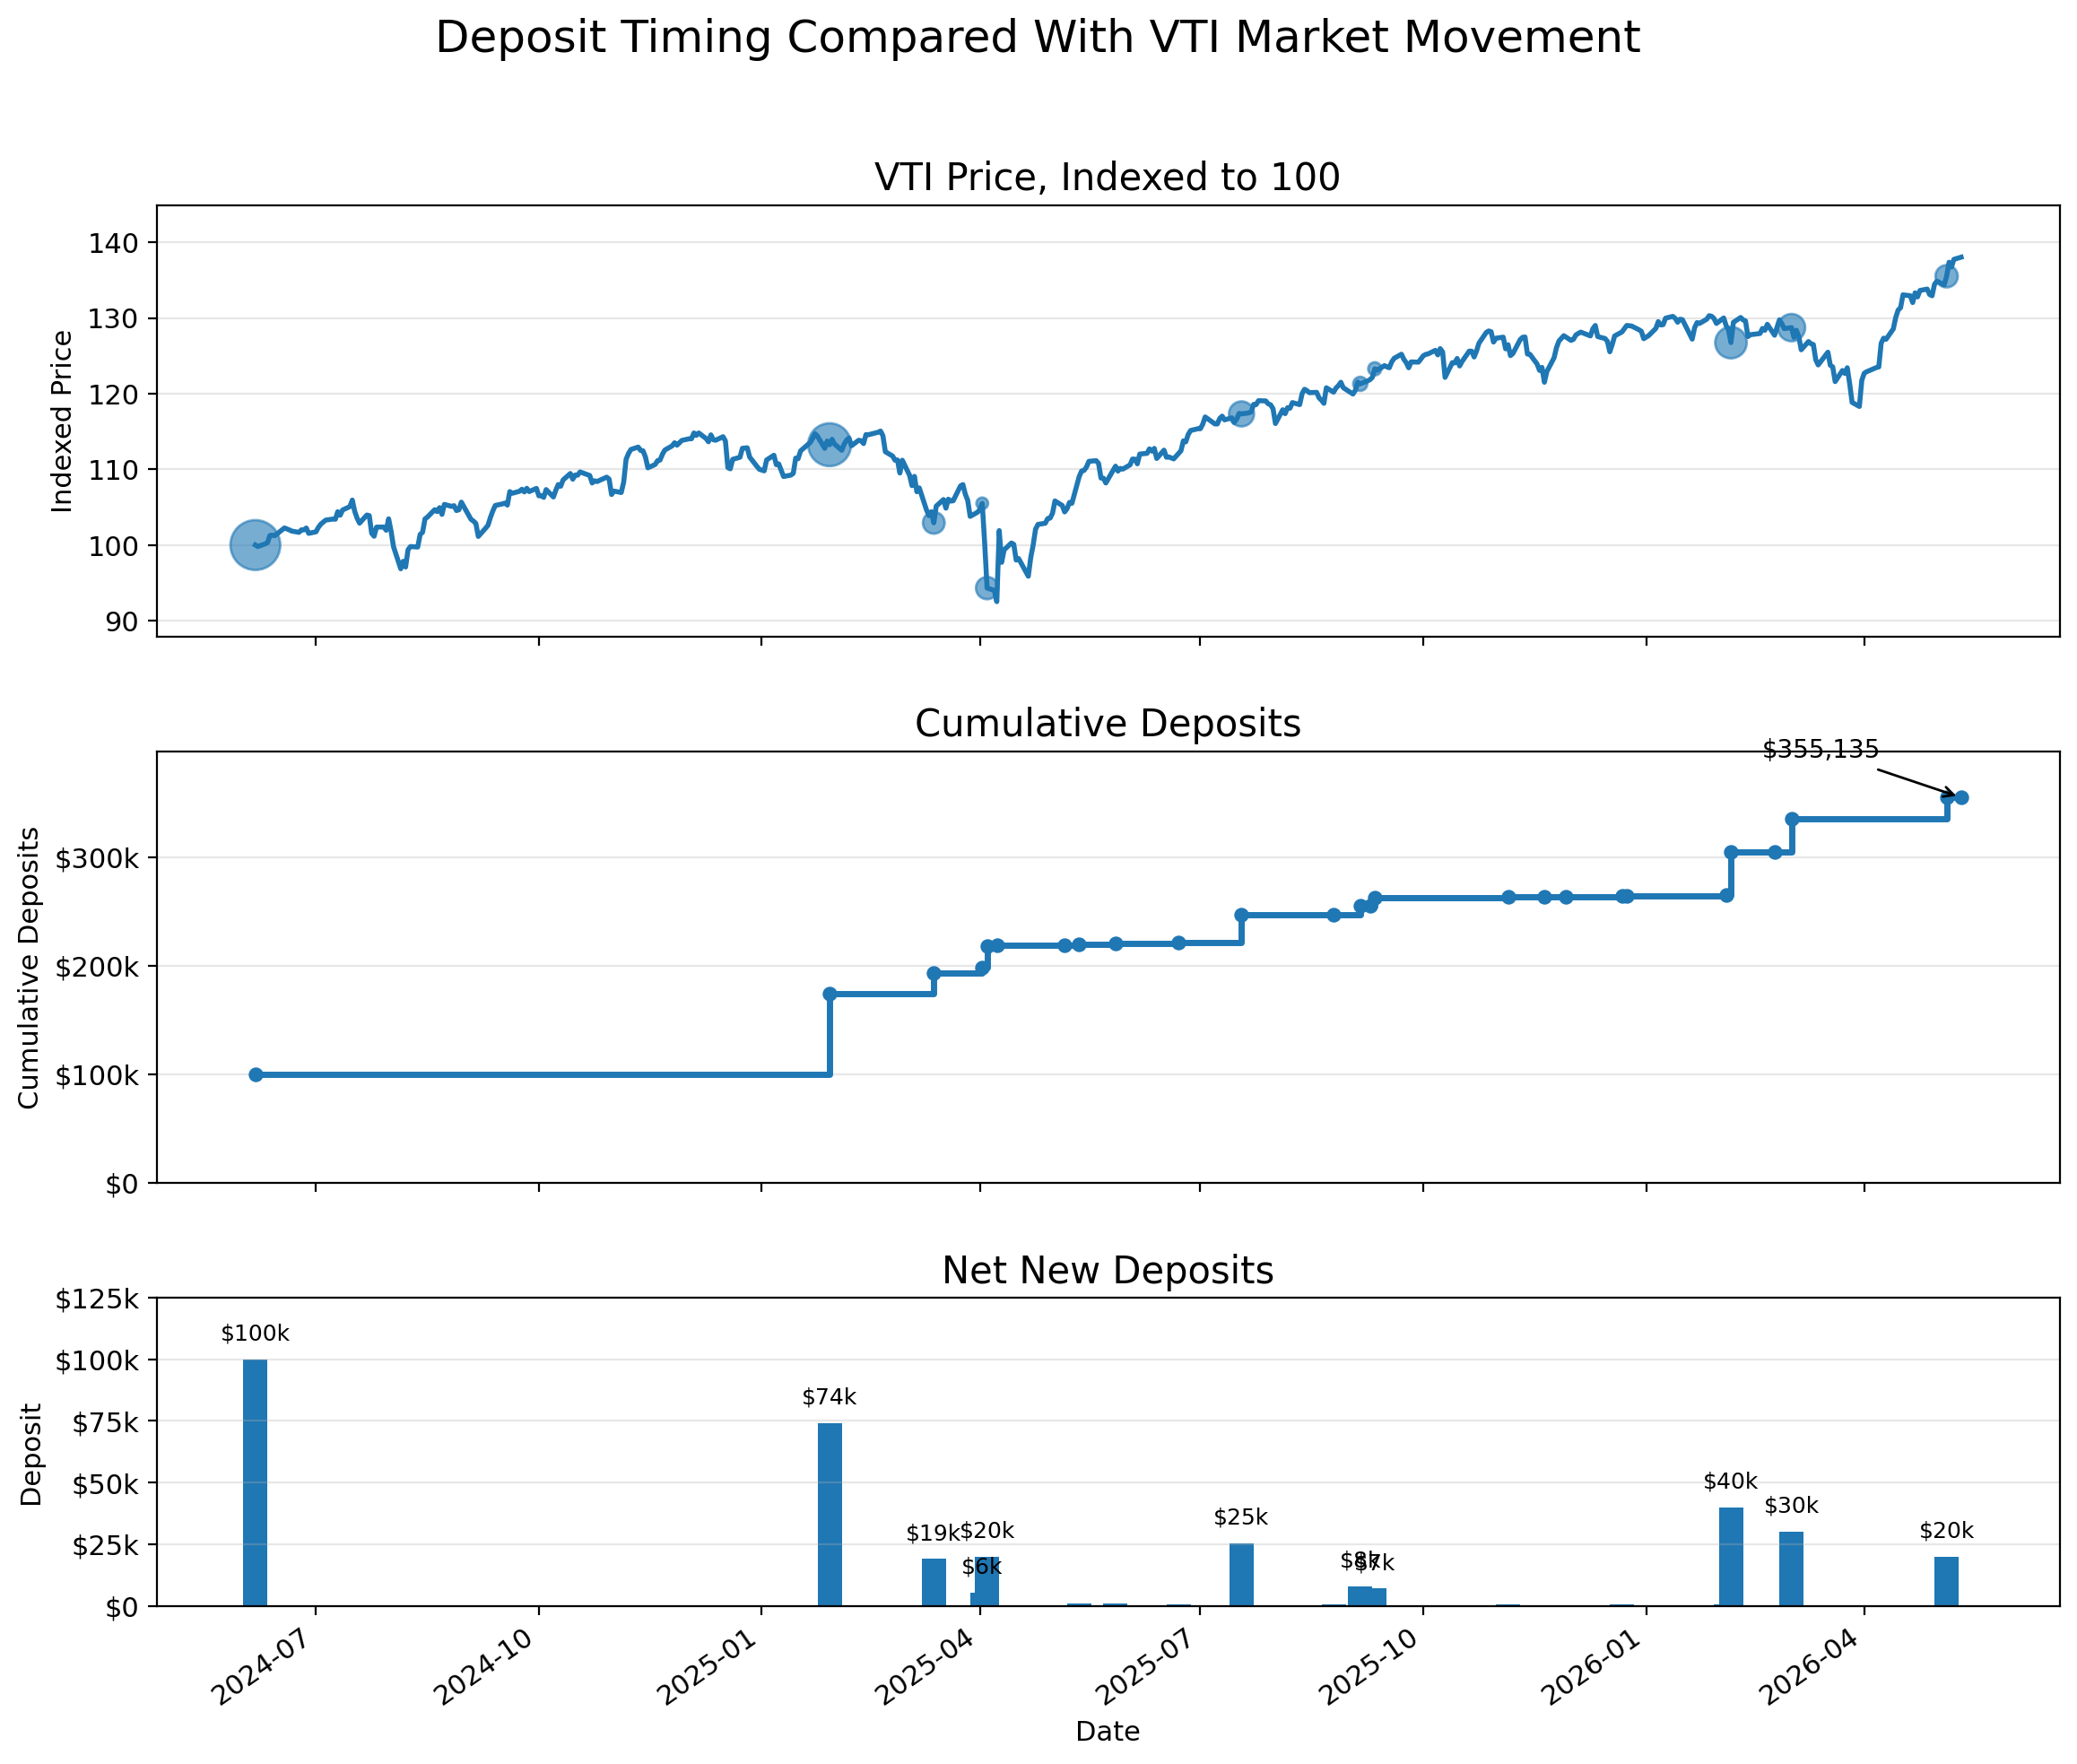
The continuous new contributions have allowed me to increase tax loss harvesting opportunities by regularly adding new shares at fresh cost basis, putting more “juice” or potential harvesting opportunities into my direct index. This approach is designed to closely track the broad market’s performance while simultaneously creating future tax loss harvesting potential into the index in my account.
Historically Frec’s research, based on historical simulations, a CRSP US Total Market may generate 29%8 of your original investment value in losses over the first 3.5 years. This is slightly more than their simulations against the S&P 500 direct index which resulted in 25%9 in losses after 3.5%. I bring up the S&P 500 comparison since Frec has longer historical simulations showing 40%10 in losses over 4 years.
Did This Make Your Taxes A Pain?
Whether having thousands of trades makes my taxes more complicated is one of the most common questions I receive. Luckily, this one comes with an easy answer!
No.
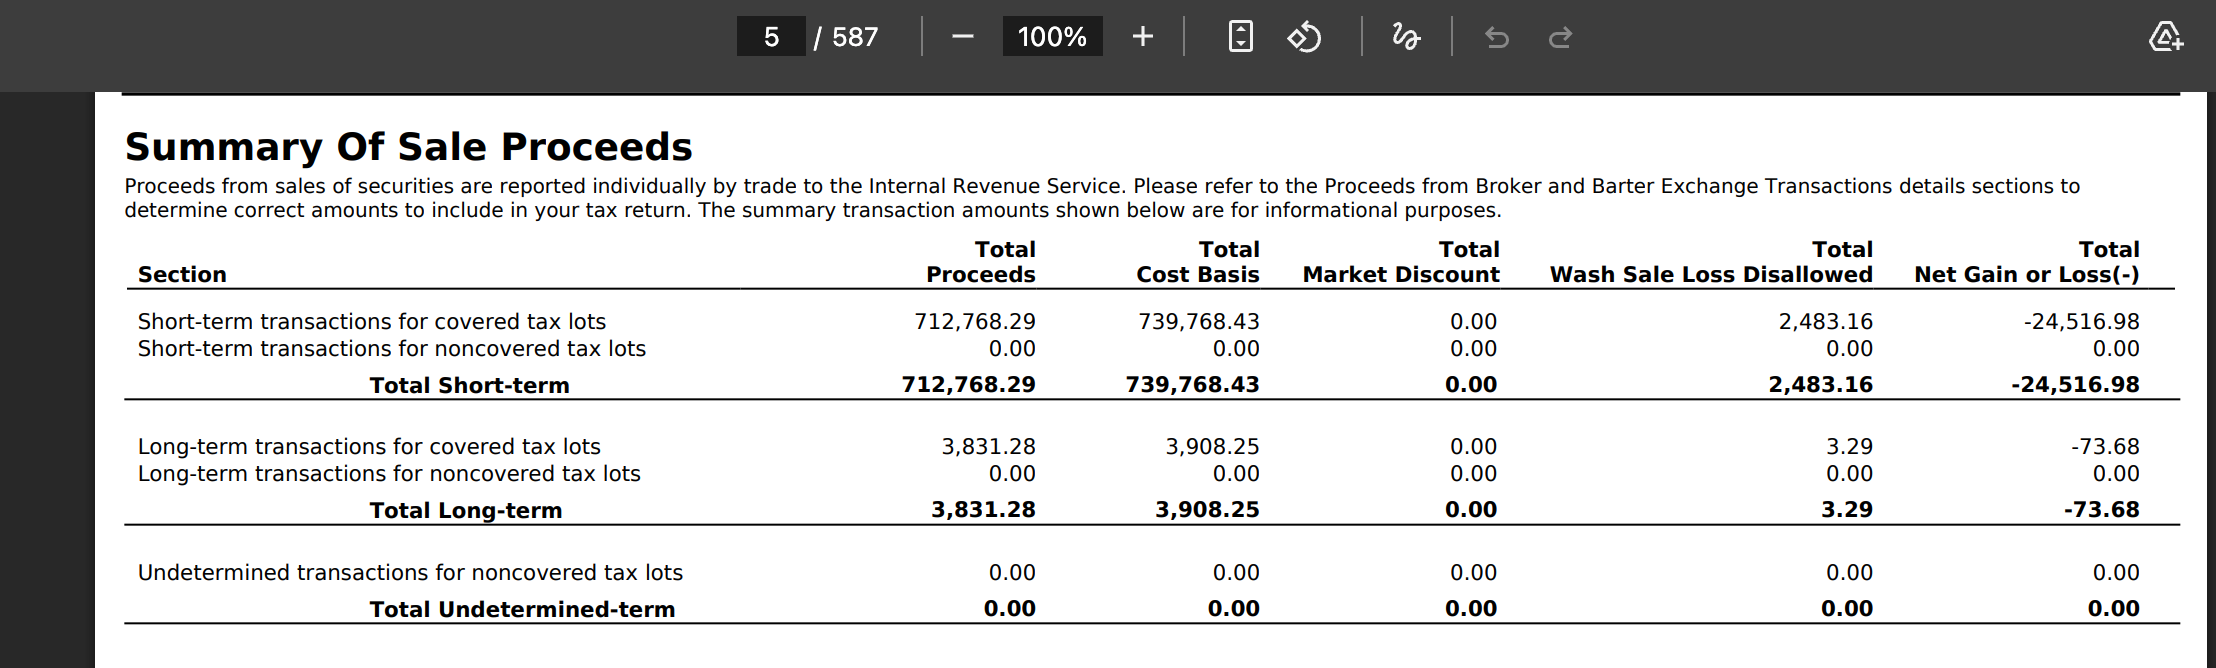
My 1099 was exactly 587 pages… But that didn’t make my taxes any more complicated than my 1099 from Fidelity. All the information I needed was directly in the summary.
Closing Thoughts
You survived the rabbit hole!
If you have more questions or want to hear more from me and Mo (Frec’s CEO), be sure to register for the upcoming FIRE-side chat!
I am getting real, after-tax value from my direct index with Frec. I’m going to keep using it as long as I have new U.S. equity contributions and a real use for the losses.
Disclosure: I am a Frec client and Frec paid a one-time fee for this newsletter. I also receive $250 for each referral that uses my link and earns $250 which creates an incentive for me to recommend Frec.
This blog represents my personal experience and may not be representative of other Frec clients. My results are not a guarantee of future performance or success, and individual clients results will vary based on market conditions, deposit timing, and personal tax circumstances. I nor Frec provide tax, legal, or accounting advice. The tax information presented is for illustrative purposes only and is based on assumed tax rates that may not apply to your situation. You should consult your own tax advisor regarding your individual circumstances before making any investment or tax-related decision.
Investing involves risk, including the risk of loss. Simulated results do not reflect actual trading and are not a guarantee of future results. Individual results will vary based on market conditions and personal tax circumstances.
Advisory services provided by Frec Advisers LLC, a SEC-registered investment advisor. Brokerage services provided by Frec Securities LLC, member SIPC/FINRA. Both are wholly owned subsidiaries of Frec Markets, Inc.
Certain illustrations in this post, specifically the VIT/VOO proxy portfolio reconstruction, are hypothetical and are presented solely to illustrate what a comparable index ETF approach might have produced over the same period using the same deposit schedule. These illustrations do not reflect any actual client account, were generated with the benefit of hindsight using assumptions selected after the fact, and may not reflect transaction costs, dividend timing, or all applicable tax effects. Past performance does not guarantee future results.
As of 5/20/2026, annual fees are 0.25% for Wealthfront’s Automated Investing Account, 0.40% for Schwab Personalized Indexing, and 0.40% for Fidelity Managed FidFolios.
A tracking error of +/- 1% is based on a 10-year simulation of the S&P 500 with a standard deviation of observed excess return over 36 simulation runs from 12/17/2003-06/10/2022 with a $50,000 deposit was 8.2% or approximately +/- 0.77% annually. The results are hypothetical, do not reflect actual investment results, and are not a guarantee of future results.
Hypothetical performance is generated via an AI-based simulation model relying on historical data and assumptions that may not reflect future market conditions. AI simulations have inherent limitations, including sensitivity to underlying data, model assumptions, and the specific historical periods analyzed. Outputs may not be fully transparent or explainable, and results may vary if run under different conditions or time frames. This simulation does not represent actual client account performance and should not be relied upon as a prediction of future results.
The performance of the comparison ETF investment is hypothetical, has not been achieved by any actual client account, and is for illustrative purposes only. Actual results will vary.
“Up to 2 times the losses” refers to results generated by Frec’s S&P 500 direct indexing model of 38.4% in tax losses harvested for Frec’s direct indexing portfolio compared to 20.2% for an ETF-to-ETF tax loss harvesting strategy. These results are hypothetical, do not reflect actual investment results, and are not a guarantee of future results. They were generated with a one-time $50,000 investment into Frec’s S&P 500 direct indexing strategy and an ETF strategy trading between SPY and IVV for a ten year time frame of ninety day increments from 12/17/2003-07/25/2023. The simulations considered a 0.10% fee structure and a 0.25% fee structure for the ETF strategy.
A tracking error of +/- 1% is based on a 10-year simulation of the S&P 500 with a standard deviation of observed excess return over 36 simulation runs from 12/17/2003-06/10/2022 with a $50,000 deposit was 8.2% or approximately +/- 0.77% annually. The results are hypothetical, do not reflect actual investment results, and are not a guarantee of future results.
Based on simulations of the S&P 500 direct index with an initial deposit of $50,000 and weekly and monthly deposits totaling $26,000 a year. There were 41 overlapping ten-year simulations, each 90 days apart between 12/17/2003-10/18/2023. 0.10% AUM was included. The results are hypothetical, do not reflect actual investment results, and are not a guarantee of future results.
29% rate is based on a historical simulation of a one-time $100,000 deposit into the CRSP US Total Market from Oct 1, 2021 to May 1, 2025, using weekly tax loss harvesting and includes Frec’s AUM Fee. Frec currently harvests daily.
25% is based on a historical simulation of a one-time $100,000 deposit into the S&P 500® from 10/1/2021 - 5/1/2025, using weekly tax loss harvesting and includes Frec's AUM Fee. Frec currently harvests daily.
40% tax losses harvested from a portfolio is based on a ten-year time frame and simulation results from Frec’s direct index model tracking the S&P 500 index. The results are hypothetical, do not reflect actual investment results, and are not a guarantee of future results. The simulations were run to tax loss harvest on a weekly basis in a ten-year time frame of ninety-day increments from 12/17/2003 - 06/10/2022 with a $50,000 initial deposit. The simulations averaged at the end of year ten resulted in a 40% accumulated tax loss savings and do not include Frec’s 0.10% fee.
Couldn’t you accomplish something similar by buying the index outright, selling covered calls, and then rolling the position forward if the index goes up?
Love the transparency (though I think I only made it halfway down the rabbit hole).
Zeroing in on "Why would you want to do this?" - reason #1 makes complete sense, and at this expense ratio is quite compelling.
I think there's actually 2 parts to reason #2 : using tax losses to de-concentrate other positions (good for many people) and using tax losses to decrease taxes owed today. For that second part, there's clear value in offsetting $3k in income, but that only goes so far. Going beyond that, I think this is accidentally a bad strategy for some people as it lowers your cost basis and potentially increases future capital gains. This comes with a TON of caveats and complexity - what is your future tax bracket, will you be in a position to never sell so your heirs can benefit from step up in cost basis, etd etc etc. So, lots of situation-specific considerations and analysis to look at there.
So curious - did your resulting cost basis go down by $45k as a result of Frec's tax loss harvesting? I may have missed it but didn't see that in your analysis.
Napkin math:
* Simple VTI / VOO buy+hold strategy would give you a cost basis of $355k (plus some, assuming you are reinvesting dividends)
* Frec's TLH would give a cost basis of $355k - $45k of tax losses == $310k (again, adjusted for dividend reinvestment)
Am I understanding that right?
Just curious - does Frec allow for transfers-in-kind in funding or contributing to accounts?